Touchgraph Navigator

Touchgraph Navigator: Interactive Visualization Software
Touchgraph Navigator displays interactive node and link diagrams of connected data, allowing users to explore relationships and connections within complex networks and data sets.
What is Touchgraph Navigator?
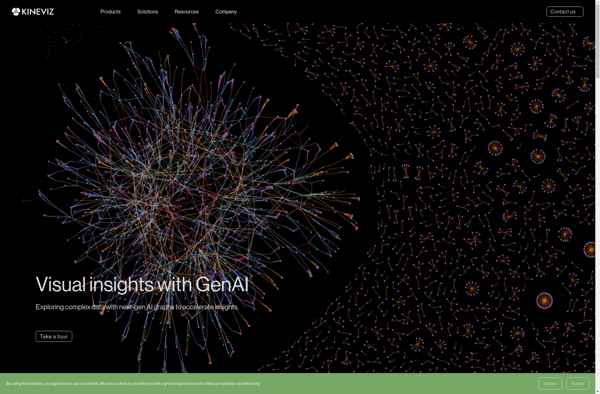
Touchgraph Navigator is an interactive graph visualization software used to visualize connected data and relationships. It displays networks and data sets as interactive node-link diagrams, allowing users to explore and understand the connections within complex data.
Some key features of Touchgraph Navigator include:
- Interactive node-link network graphs that users can explore by clicking, dragging, and zooming
- Automatic graph layout algorithms that organize the network visually
- Integration with databases and APIs to load external data sources into the graphs
- Real-time filtering to highlight relevant nodes and links based on search queries
- Customizable node and link appearance to embed metadata visibly into the graph
- Exporting graphs as images or raw data
- An intuitive user interface making it easy for non-technical users to take advantage of advanced graph analysis techniques
Touchgraph Navigator helps reveal patterns, relationships, clusters, and anomalies across interconnected data that are difficult to discern from raw data tables. It has applications in social network analysis, business intelligence, academic research, network security, and other domains involving complex data.
Touchgraph Navigator Features
Features
- Interactive node-link network visualization
- Real-time graph layout
- Filtering, searching and highlighting network connections
- Navigation history and back button
- Customizable node and link appearance
- Import/export network data
Pricing
- Free
- One-time Purchase
- Subscription-Based
Pros
Cons
Official Links
Reviews & Ratings
Login to ReviewThe Best Touchgraph Navigator Alternatives
Top Ai Tools & Services and Data Visualization and other similar apps like Touchgraph Navigator
GraphXR

Socilyzer
