Trendulus is a free, open source data visualization and analysis tool. It allows users to easily create interactive charts and graphs to analyze trends in their data over time. Useful for understanding patterns and making data-driven decisions.
Trendulus: Free Data Visualization and Analysis Tool
Trendulus is a free, open source data visualization and analysis tool. It allows users to easily create interactive charts and graphs to analyze trends in their data over time. Useful for understanding patterns and making data-driven decisions.
What is Trendulus?
Trendulus is an open source data visualization and analysis application. It provides an intuitive graphical interface that allows users to easily import, analyze, and visualize time series data to identify trends and patterns.
Some of the key features of Trendulus include:
Interactive and customizable charts and graphs such as line, bar, stacked bar, scatter plots, and more
Analysis tools like smoothing, interpolation, forecasting, anomalies detection, and breakdowns
Support for long term trend analysis with options to zoom in on specific date ranges
Visualization customization like applying color palettes, changing chart types, adding reference lines, etc.
Data import from CSV files and other sources like databases
Exporting charts as images or underlying data
An extensible architecture that allows developers to add new visualizations and analytics features
With its user-friendly interface combined with powerful analytics capabilities, Trendulus is ideal for understanding time series data for making critical business decisions driven by data, not just intuition.
4chan is an anonymous English-language imageboard website. Launched in 2003, it allows users to post images and comments, which expire after a short period of time. It's split into various boards dedicated to different topics including Japanese anime, video games, music, and photography.Its most popular and controversial board is /pol/,...
What Is Reddit?Reddit is a social news aggregation and discussion platform organized into communities called subreddits. With over 50 million daily active users, it hosts discussions on virtually every topic — from technology and science to hobbies, local communities, and niche interests.Key FeaturesContent is organized into subreddits (r/technology, r/cooking, r/gaming,...
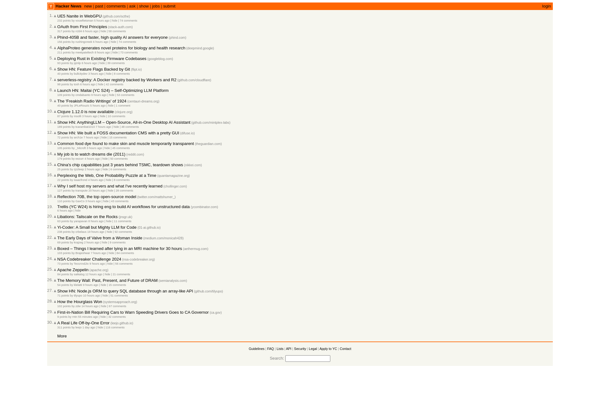
Hacker News is an online community and social news website with a focus on computer science, programming, entrepreneurship, artificial intelligence, technology-related ideas and innovations, and internet/Silicon Valley startups. The site features user-submitted links to technology-related articles, blog posts, and discussions, which site members can comment on and vote up or...
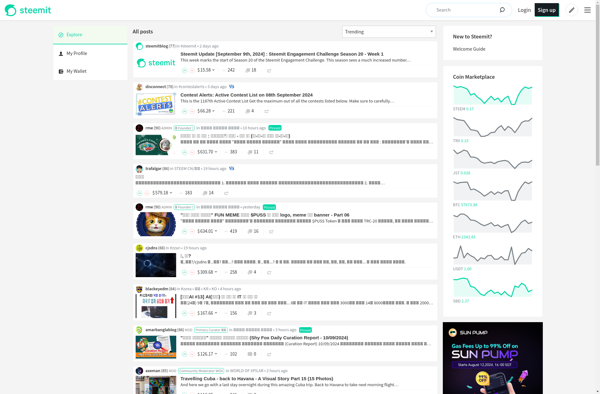
Steemit is a blockchain-based social media platform where anyone can earn rewards for creating and curating content. The platform uses its own cryptocurrency called Steem which has monetary value and can be traded on exchanges.On Steemit, users can post articles, photos, videos, and other content just like traditional social media....
Snapzu is a social news aggregation, web content rating, and discussion website launched in 2012. It has elements of Reddit and other social news aggregation sites, allowing members to post links, text posts, images, and videos and have discussions.What makes Snapzu unique is its use of Tribes. Tribes function like...
Tildes is a community web site that was created in 2018 as an alternative to Reddit. Its goal is to enable intelligent, nuanced conversations by discouraging toxicity and low-quality content.Some key features of Tildes include:User groups and tags to better categorize contentStrict moderation policies to reduce trolling, baiting, and outrage...
SaidIt.net is an open source Reddit alternative website that launched in 2019. It focuses on privacy, transparency, and giving more control to moderators and communities.Some key features of SaidIt.net include:Open source codebase - Available on GitHub for anyone to view, fork, and contribute to.User privacy focused - No tracking of...
Infinity for Reddit is a free and open-source Reddit client app for Android. It provides an innovative interface to access and interact with Reddit, with an emphasis on customization, privacy, and user experience.Some key features of Infinity for Reddit include:Modern, intuitive interface with multiple themes and customization optionsSupport for multiple...
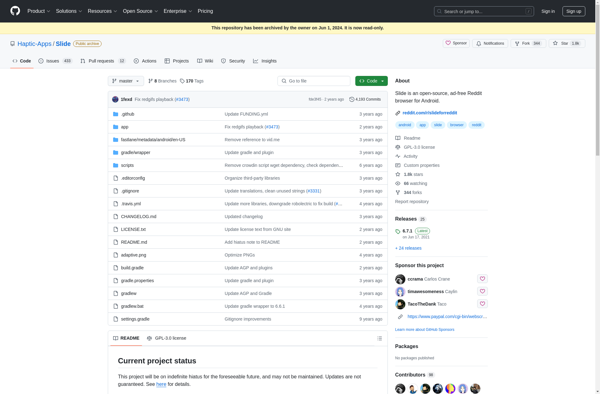
Slide for Reddit is a popular third-party Reddit browser and client application available for Android and iOS mobile devices. It provides an alternative way to access, view, and engage with Reddit content compared to the official Reddit mobile app.Some key features of Slide for Reddit include:A simple and intuitive slide-based...
Raddle is an open-source alternative to Reddit developed as a privacy-focused community discussion platform. As a Reddit alternative, Raddle does not show ads or track and profile its users' activity and data. It is developed by a non-profit organization with the goal of providing an ethical and liberating discussion platform.Some...