VISUALZ
Visualz: Data Visualization and Business Intelligence Software
Connect to data sources, create interactive dashboards and charts, and share analytics through the cloud with Visualz, a software that enables data analysis and visualization without coding.
What is VISUALZ?
Visualz is a business intelligence and data visualization platform used to visualize, analyze, and share data insights. It allows anyone on a team to connect data from multiple sources, create interactive dashboards and charts, and share analytics through the cloud.
Some key features of Visualz include:
- Intuitive drag-and-drop interface to build dashboards without coding
- Connect to a variety of data sources like SQL, MongoDB, REST APIs, CSV, and more
- Create different charts and graphs like bar, pie, line, scatter plots, gauges, maps, and more
- Interactive dashboards with filtering, drilling, sorting, highlighting, and other capabilities
- Scheduled reports, alerts based on metrics, and automated distribution through emails
- Role-based access control for security and governance
- Integration with applications like Tableau, Power BI, Excel, etc through embed codes
Visualz is built for business teams of all sizes looking to make data-driven decisions faster with easier data analysis and visualization, without having to rely on IT or developers. Its easy-to-use interface makes it possible for anyone to connect data from multiple sources, build reports and dashboards, and share analytics securely across their organization.
VISUALZ Features
Features
- Drag-and-drop interface to create dashboards
- Connects to various data sources like SQL, MongoDB, REST APIs
- Has a library of customizable chart types like bar, pie, line, scatter plots etc
- Allows collaboration by sharing dashboards with other users
- Has alerting and scheduling capabilities
- Provides APIs to embed dashboards into other apps
- Works across devices - web, mobile and tablets
- Has governance features like row-level security
Pricing
- Freemium
- Subscription-Based
Pros
Cons
Official Links
Reviews & Ratings
Login to ReviewThe Best VISUALZ Alternatives
View all VISUALZ alternatives with detailed comparison →
Top Business & Commerce and Data Analysis & Visualization and other similar apps like VISUALZ
Here are some alternatives to VISUALZ:
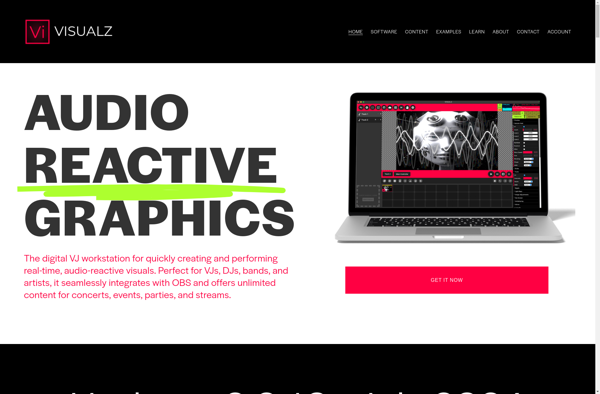
Suggest an alternative ❐VJmachine 2.0
ZGameEditor Visualizer
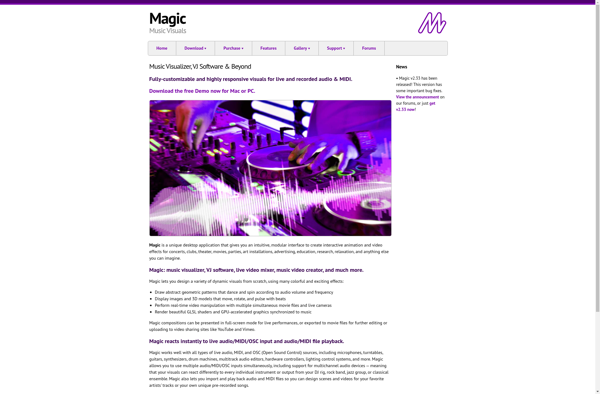
Magic Music Visuals
VZX Music Visualizer