Win32Trace is an open-source tracing and debugging tool for Windows. It can trace function calls, exceptions, events, threads, processes, modules, images, and more to help debug applications.
Win32Trace: Open-Source Tracing and Debugging Tool for Windows
An open-source tracing and debugging tool for Windows to trace function calls, exceptions, events, threads, processes, modules, images, and more.
What is Win32Trace?
Win32Trace is an open-source application tracing and debugging tool for Windows platforms. It utilizes the tracing abilities in the Windows operating system to monitor various aspects of running applications and services.
Some of the key features of Win32Trace include:
Function call tracing - Trace every function call made by a process, including function parameters and return values.
Exception tracing - Log all exceptions triggered in an application.
Event tracing - Monitor various Windows events like file system, registry, network, etc.
Process and module tracing - Record process starts/stops and modules loads/unloads.
Kernel object tracing - Trace creation/deletion of objects like files, registry keys, network sockets, events etc.
Win32Trace collects very detailed tracing data with extremely low overhead, allowing it to trace even very high frequency events. The tracing data can be logged to file or viewed in real-time. It includes rich filtering, highlighting and analysis features to pinpoint issues.
Win32Trace helps debug tricky application and service crashes, performance issues, threading bugs, handle leaks, etc. Its detailed traces can uncover root cause of problems that are otherwise very difficult to diagnose.
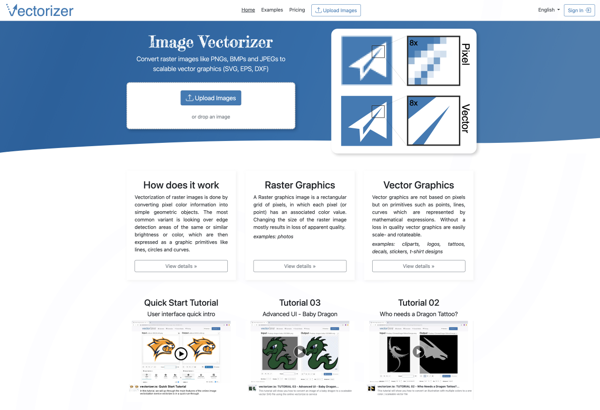
Vectorizer.io is an innovative online application that utilizes artificial intelligence and machine learning to convert raster images such as JPEGs, PNGs, and other bitmap file types into high-quality vector graphics formats including SVG, EPS, PDF, and more.With Vectorizer.io's intelligent auto-tracing algorithms, complex images with many details, colors, and gradients can...
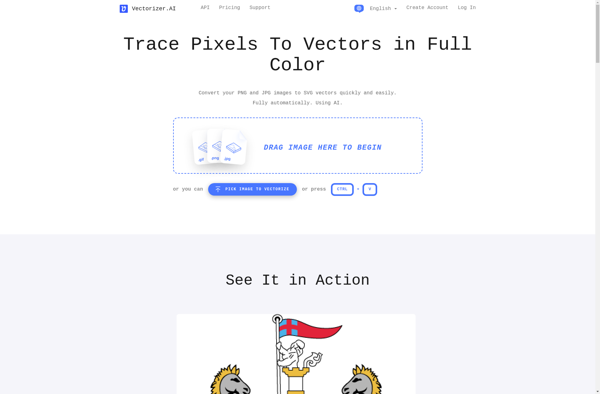
Vectorizer.ai is an innovative online vectorization software that leverages advanced artificial intelligence and machine learning to effortlessly convert raster images like JPGs, PNGs and other bitmap graphics into high-quality scalable SVG vector images. It completely automates the vector tracing process, eliminating the need for manual tracing in vector graphics softwares.With...
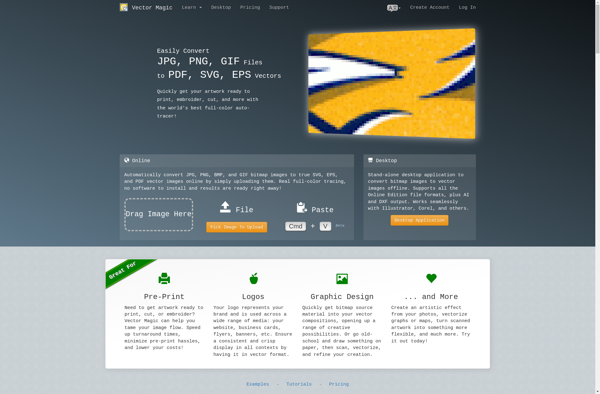
Vector Magic is a raster-to-vector conversion software that takes bitmap images like JPEGs, GIFs, and PNGs and converts them into scalable and editable vector graphic files. It uses state-of-the-art artificial intelligence and machine learning algorithms to analyze raster images and trace out curves, lines, and shapes to rebuild them as...
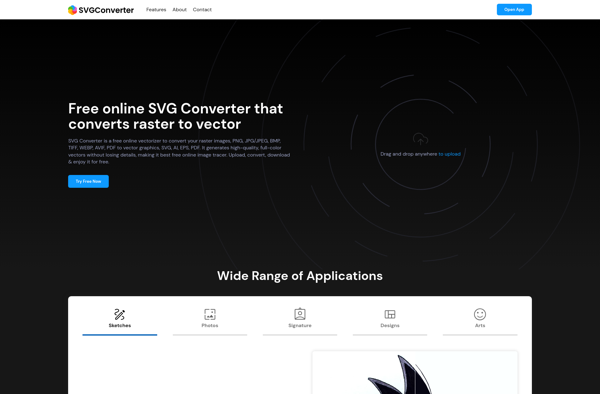
SVGConverter is a free online SVG conversion utility that allows you to easily convert your SVG files to various raster and vector image formats like PNG, JPG, TIFF, GIF, PDF, EPS and more. It is very easy to use - you just need to upload your SVG file, choose the...
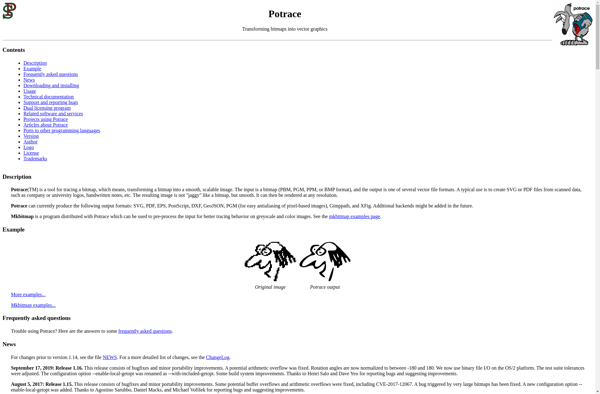
Potrace is an open source bitmap tracing utility used to convert bitmap images into vector graphics. It takes a bitmap image such as JPG, GIF, PNG as input and produces a smooth, high quality vector image by tracing the outlines of the original bitmap.Some key features of Potrace include:Converts bitmap...
CR8tracer is an open-source continuous profiling and tracing tool designed specifically for Node.js applications. It allows developers to monitor the performance of their Node.js apps in real-time in production and development environments.Some key features of CR8tracer include:Automatic instrumentation of Node.js apps without code changesFlame graphs showing hot functions and call...
DragPotrace is a free, open source bitmap tracing and vectorization software for Windows. It allows users to easily convert bitmap images like JPG, PNG, BMP and more into vector graphics formats such as SVG, DXF, and more.Some key features of DragPotrace include:Intuitive drag and drop interface to import bitmap images...
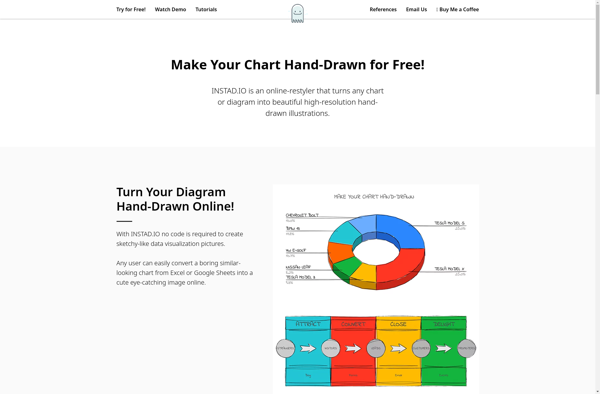
Instadio is podcast creation and management software designed specifically for internal business communication. It allows organizations to easily create, manage, and distribute podcasts internally across the company.With Instadio, any employee can record a podcast episode right from their computer using simple recording and editing tools. Managers can then review and...
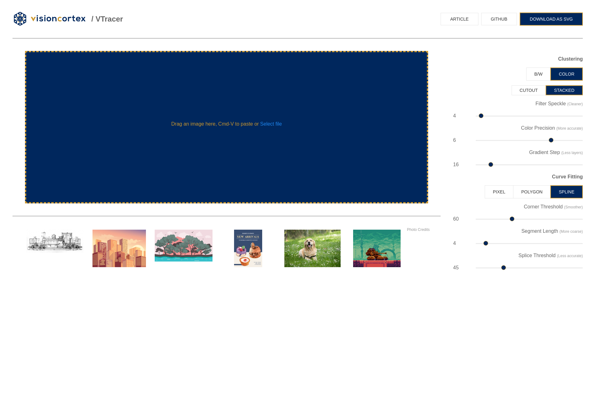
VTracer is a visual regression testing tool designed specifically for testing websites and web applications. It works by capturing screenshots of web pages across different browsers, devices, and viewports and comparing them against baseline reference screenshots.Some key features of VTracer include:Cross browser testing - Capture screenshots in all major desktop...
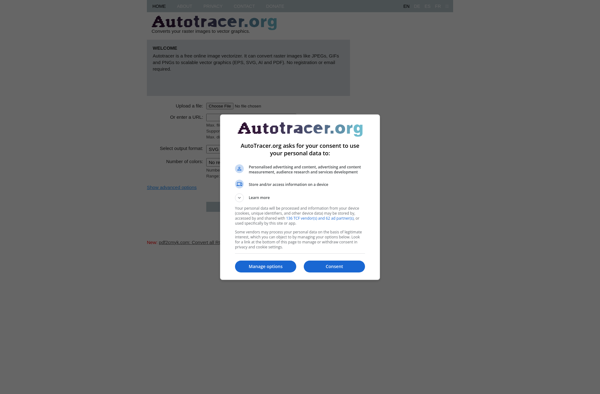
Autotracer.org is a free online automated vectorization service powered by the open source Potrace vectorization engine. It allows users to easily convert bitmap images like JPG, PNG and TIFF files into scalable and editable vector image formats like SVG, DXF, and EPS.The service is very easy to use. Users simply...
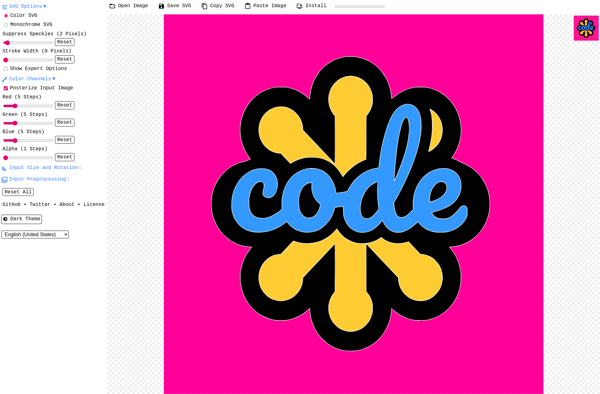
SVGcode is a free, open-source vector graphics editor designed specifically for working with Scalable Vector Graphics (SVG) files. As an SVG editor, it provides a complete toolset for creating, editing, and exporting SVG images and web graphics.Key features of SVGcode include:Intuitive user interface for drawing basic shapes, freehand paths, text,...