Yakindu Statechart Tools is an open-source modeling tool for developing reactive, event-driven systems and complex business logic. It is based on statecharts and provides a graphical editor, code generators, simulation, debugging, test case generation, and documentation generatio
Yakindu Statechart Tools: Open-Source Modeling for Reactive Systems
Yakindu Statechart Tools is an open-source modeling tool for developing reactive, event-driven systems and complex business logic. It is based on statecharts and provides a graphical editor, code generators, simulation, debugging, test case generation, and documentation generation.
What is Yakindu Statechart Tools?
Yakindu Statechart Tools is an open-source modeling tool for developing reactive, event-driven systems and complex business logic. It is based on the statecharts formalism and provides a graphical statechart editor, code generators for multiple target languages (C, C++, Java, Python), simulation, debugging, automated test case generation, and documentation generation.
Key features include:
Graphical statechart editor with support for hierarchies, parallel regions, history states, deep history states, events, guard conditions, effects, entry/exit actions, and transitions.
Simulation allows interactive execution and debugging of statecharts.
Code generators for generating program code stubs from statecharts.
Support for unit testing by generating test cases from statecharts.
Documentation generator extracts details from statecharts into a report.
Active development community with regular releases.
Eclipse-based with plugin extensions available.
Free and open-source under the Eclipse Public License.
Yakindu Statechart Tools is commonly used for developing embedded and real-time systems, reactive applications, complex business logic, workflow and process control systems, and prototyping state machine models. The automated code generation and testing features make it suitable for agile development approaches.
Yakindu Statechart Tools Features
Features
Graphical editor for creating statecharts
Code generators for C, C++, Java and Python
Simulation and debugging
Test case generation
Documentation generation
Pricing
Open Source
Pros
Open source and free
Support for multiple languages via code generators
Good for developing reactive, event-driven systems
Helpful tools like simulation, debugging and test case generation
Cons
Limited community and support compared to commercial tools
Steep learning curve for those new to statecharts
Lacks some features like requirements tracing found in commercial tools
MATLAB (matrix laboratory) is a multi-paradigm numerical computing environment and proprietary programming language developed by MathWorks. MATLAB allows matrix manipulations, plotting of functions and data, implementation of algorithms, creation of user interfaces, and interfacing with programs written in other languages.Some key features of MATLAB include:Matrix and array-oriented language for faster...
Enterprise Architect is a comprehensive visual modeling and design solution for designing and constructing software systems, business processes and enterprise architectures. It supports numerous modeling languages including UML, SysML, BPMN, ArchiMate and many more.Key features include:Intuitive graphical interface for diagramming software models, business processes, infrastructure, organizational structures and moreRobust code...
StarUML is an open-source software modeling application for creating and editing Unified Modeling Language (UML) diagrams. It is cross-platform, running on Windows, Linux and Mac operating systems.Some key features of StarUML include:Support for all 14 standard UML 2.5 diagram types such as use case diagrams, class diagrams, sequence diagrams, activity...
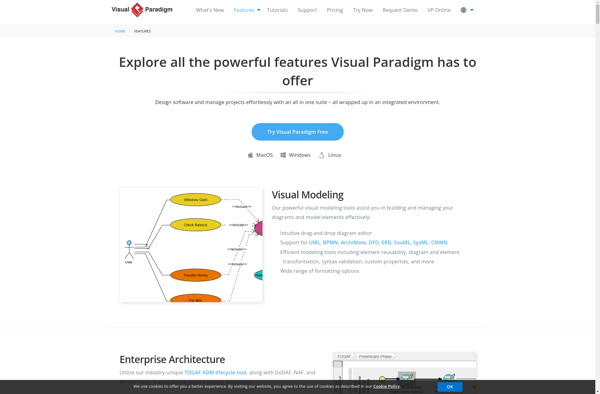
Visual Paradigm is a professional UML modeling software used by software developers and architects for software design and architecture. It supports all standard UML 2.x diagrams like use case diagrams, class diagrams, sequence diagrams, activity diagrams, communication diagrams, state machine diagrams, deployment diagrams, component diagrams, and more.Key features of Visual...
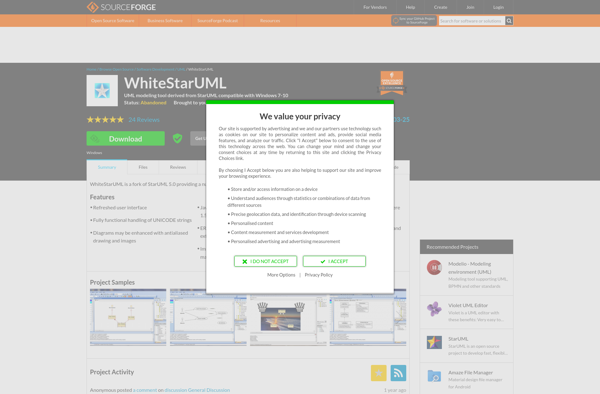
WhiteStarUML is an open-source Unified Modeling Language (UML) modeling tool that runs on Windows, Linux and Mac operating systems. It allows software developers and architects to create various types of UML diagrams like class diagrams, sequence diagrams, use case diagrams, state machine diagrams and activity diagrams.It has basic compliance with...
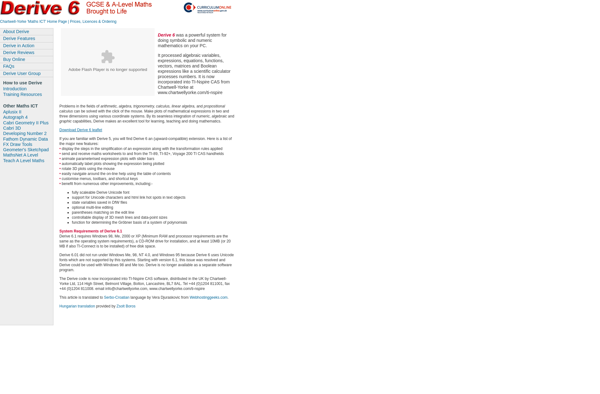
Derive is a mathematical and graphical software program used for symbolic and numeric manipulation and visualization of mathematical expressions. Originally released in 1988 by Soft Warehouse Inc, Derive provides a graphical user interface for performing various mathematical calculations and analysis.With Derive, users can perform symbolic and numeric calculations, plot 2D...
MagicDraw is a visual architecture and modeling tool used by software developers, systems engineers, and business analysts to model application structure, behavior, and business processes. It supports various standard modeling notations including UML, SysML, BPMN, and more.MagicDraw provides an intuitive graphical interface to create various diagrams like use case diagrams,...
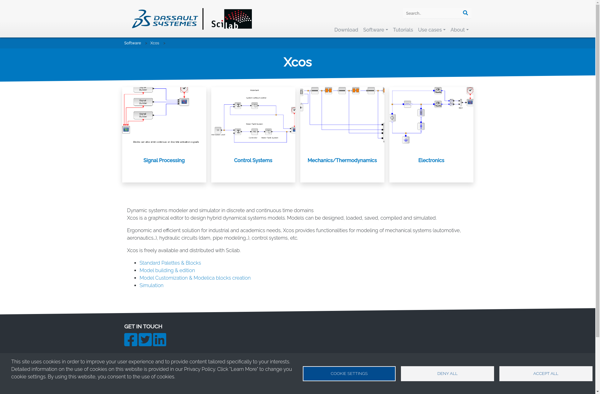
Xcos is an open-source software specialized in the simulation of dynamical systems, offering modeling and simulation features specifically oriented towards control systems. It is developed as a graphical user interface module for Scilab, the open source platform for numerical computation.Some key features of Xcos include:Block diagram model editor for building...
GenMyModel is an open-source no-code machine learning platform. It allows anyone to build, train and deploy machine learning models visually by connecting blocks, without writing any code.Some key features of GenMyModel:Intuitive drag-and-drop interface to construct ML pipelinesLarge library of blocks for data preparation, feature engineering, model building, evaluation etc.Support for...
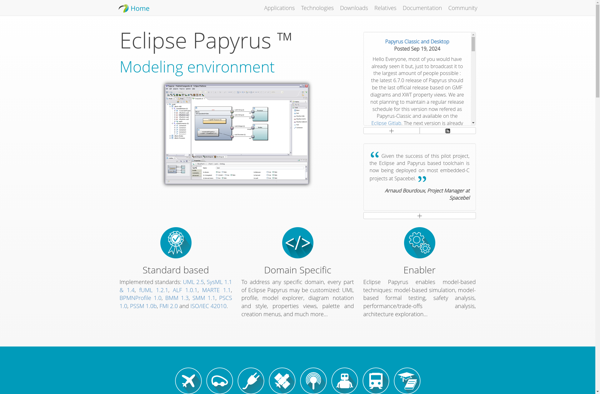
Papyrus UML is an open source tool for modeling software systems with the Unified Modeling Language (UML). Developed as an Eclipse plug-in, Papyrus provides a rich graphical editor for constructing and visualizing various UML diagrams including use case diagrams, class diagrams, state machine diagrams, activity diagrams, communication diagrams, and more.Some...
VisSim is a visual block diagram software used for simulating dynamic systems and modeling physical processes. It provides a graphical programming environment for creating models by connecting functional blocks, with no need for text-based coding.Some key features of VisSim include:Drag-and-drop interface for quickly building models by connecting block diagramsExtensive library...