Aveloy Graph vs JavaScript InfoVis Toolkit
A side-by-side look at Aveloy Graph and JavaScript InfoVis Toolkit. For an in-depth review of either product, follow the links below.

Aveloy Graph
Business & Commerce
Aveloy Graph is a no-code business intelligence analytics and visualization software for building interactive dashboards. It enables users to connect data, create charts and metrics, build dashboard layouts, and share analytics through an intuitive drag-and-drop interface without coding.
data-visualizationdashboardnocodedraganddropanalytics
JavaScript InfoVis Toolkit
Development
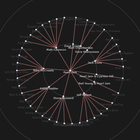
The JavaScript InfoVis Toolkit is an open-source JavaScript library for creating interactive data visualizations for the web. It provides tools for charts, graphs, diagrams, and other visual representations of complex data.
data-visualizationchartsgraphsdiagrams
Related Comparisons
OriginPro
python(x,y)
Matplotlib
GeoGebra CAS Calculator