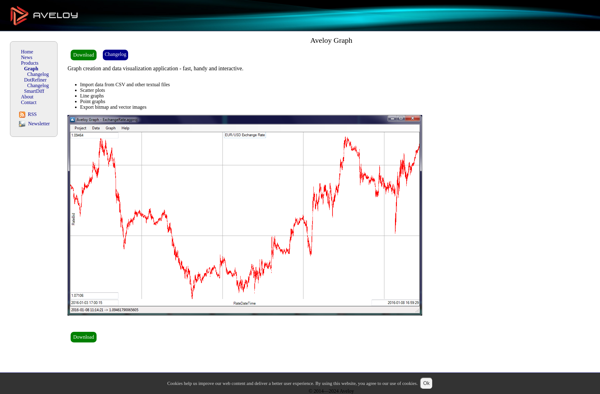
Aveloy Graph
Description: Aveloy Graph is a no-code business intelligence analytics and visualization software for building interactive dashboards. It enables users to connect data, create charts and metrics, build dashboard layouts, and share analytics through an intuitive drag-and-drop interface without coding.
Type: software
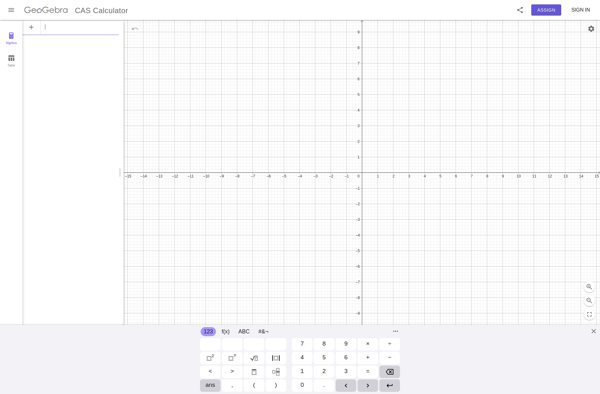
GeoGebra CAS Calculator
Description: GeoGebra is a free open-source dynamic mathematics software for all levels of education. It combines geometry, algebra, tables, graphing, statistics and calculus in one easy-to-use package. It can be used for graphing equations and functions, exploring geometry, providing dynamic representations of mathematical concepts, developing student worksheets, and assessments.
Type: software
Pricing: Open Source