ggvis vs PaintCode
A side-by-side look at ggvis and PaintCode. For an in-depth review of either product, follow the links below.

ggvis
Data Visualization
ggvis is an R package for creating interactive data visualizations and graphics in a web browser. It builds on the popular ggplot2 package but allows users to add interactivity, make visualizations reusable, and embed them in web pages.
rggplot2interactivedata-visualizationgraphicsweb-browser
PaintCode
Photos & Graphics
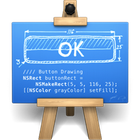
PaintCode is a vector drawing app that converts drawings into real Swift or Objective-C code. It allows designers to create app prototypes and animations using a familiar drawing interface, rather than having to write code.
vectordrawingcode-generationprototyping
Related Comparisons
CanvasJS Charts
Bokeh
Marple
WebCode
QuartzCode
Zecoda