GitHub Visualizer
Description: GitHub Visualizer is a data visualization tool that allows you to create interactive graphs and charts from GitHub repository data. It can visualize information like commits over time, contributor activity, code frequency, network graphs, and more to provide insights into your project.
Type: software
Pricing: Open Source
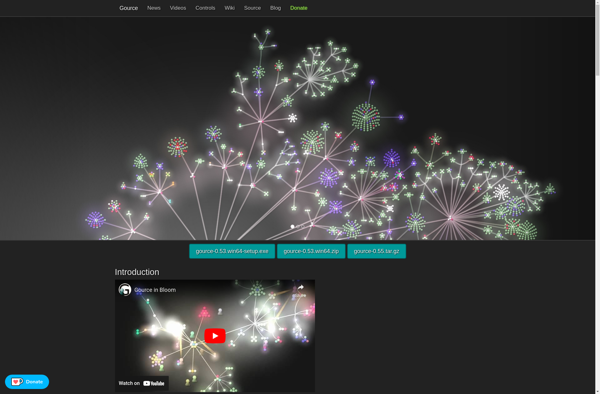
Gource
Description: Gource is an open-source visualization tool for software development that displays software repositories as interactive animations. It shows files, branches, commits, and contributors over time in a fast-forwarded animation to help visualize a project's development.
Type: software
Pricing: Open Source