GitHub Visualizer
GitHub Visualizer is a data visualization tool that allows you to create interactive graphs and charts from GitHub repository data. It can visualize information like commits over time, contributor activity, code frequency, network graphs, and more to provide insights into your pr

GitHub Visualizer: Create Interactive Graphs and Charts
Visualize GitHub repository data with commits over time, contributor activity, code frequency, network graphs, and more to gain project insights.
What is GitHub Visualizer?
GitHub Visualizer is a powerful data visualization and analytics tool specifically designed for GitHub repositories. It lets you connect your GitHub account and generate visualizations and metrics to gain valuable insights from your project's data.
Some key features of GitHub Visualizer include:
- Interactive graphs and charts - Easily create line, bar, pie and network graphs to visualize commits, contributors, code frequency, dependencies, and more over any date range.
- Project analytics - Get an overview of your project's community health, exploration statistics like traffic sources and activity. Great for analyzing growth.
- Customizable reporting - Generate custom PDF reports showing visualizations and project metrics to share with your team or stakeholders.
- Trend analysis - Identify trends and correlations in your project by comparing time-based aggregations for metrics like commits, issues and pull requests.
- Code analysis - Understand code base structure through code browser with frequency and dependency graphs for functions, classes, etc.
- Repository comparison - Benchmark your repo against major open source projects or compare owned private repos by key metrics.
With an easy to use drag and drop interface and sharing features, GitHub Visualizer helps you turn project data from GitHub into actionable insights with compelling visuals.
GitHub Visualizer Features
Features
- Interactive graphs and charts
- Visualize commits over time
- View contributor activity
- Analyze code frequency
- Create network graphs
Pricing
- Open Source
Pros
Intuitive visualization of GitHub data
Helpful for understanding project activity
Good for identifying trends and patterns
Nice graphs and charts
Free and open source
Cons
Limited to GitHub data only
Steep learning curve
Setup and configuration can be complex
Lacks some advanced analytics features
Visualizations are static, not live updated
Official Links
Reviews & Ratings
Login to ReviewThe Best GitHub Visualizer Alternatives
View all GitHub Visualizer alternatives with detailed comparison →
Top Development and Version Control and other similar apps like GitHub Visualizer
Here are some alternatives to GitHub Visualizer:
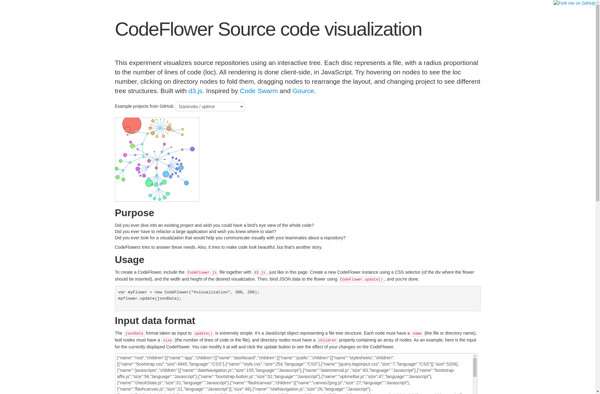
Suggest an alternative ❐CodeFlower
CodeFlower is an open-source visualization tool used for analyzing and understanding source code. It processes codebases to generate interactive diagrams that visualize the structure, dependencies, complexity, and evolution of software systems.Some key features of CodeFlower include:Creates graphical maps of codebases showing packages, classes, functions and their relationshipsVisualizes complexity metrics like...
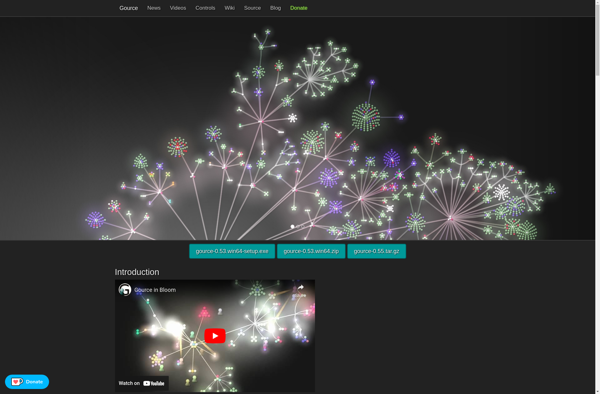
Gource
Gource is an open-source visualization tool for software development that displays software repositories as animated trees over time. It takes version control log file data, such as from Git or SVN, and replays the commits visually to produce an animation that shows the evolution of a software project.Some key features...
Git Visualizer
Git Visualizer is an open-source application designed specifically for visualizing Git repositories and commit histories. It provides developers with an interactive graph of their Git timeline to help understand and navigate even the most complex repositories.Some key features of Git Visualizer include:Interactive graph of commit history showing branches, merges, authors,...
Github Visualize
Github Visualize is a free online service that helps developers visualize and navigate code in GitHub repositories. It scans through codebases and generates interactive maps of the files, folders, classes, functions and more to provide visual overviews of large and complex codebases.Some key features of Github Visualize:It creates visual dependency...

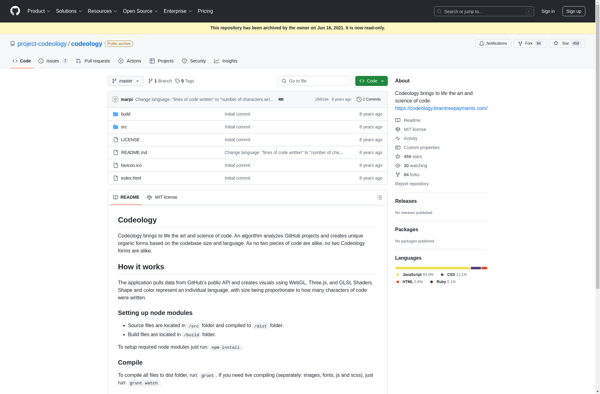
Codeology
Codeology is a feature-rich code editor and IDE designed specifically for software developers and development teams. It provides advanced coding assistance including intelligent code completion powered by AI, error detection, powerful debugging capabilities, built-in version control, and comprehensive project management tools.Key features of Codeology include:Intelligent code completion - Codeology uses...