Git Visualizer
Git Visualizer: An Open-Source Graphical Git Repository Viewer
Visualize your Git repository with branches, commits, and merges in a clear and interactive format. Discover the features of Git Visualizer for a better understanding of your project's history.
What is Git Visualizer?
Git Visualizer is an open-source application designed specifically for visualizing Git repositories and commit histories. It provides developers with an interactive graph of their Git timeline to help understand and navigate even the most complex repositories.
Some key features of Git Visualizer include:
- Interactive graph of commit history showing branches, merges, authors, dates
- Ability to search, filter, highlight specific commits/branches
- Details on demand - click node to see commit details and diff
- Support for remote repositories on GitHub, Bitbucket, GitLab, etc.
- Shareable shortlinks for visualized repo graphs
- Completely client side - runs fully in the browser
- Open source and free for anyone to use or self host
With its simple but powerful visualization capabilities, Git Visualizer aims to help developers gain better insight into their Git repositories. Whether trying to understand a complex open source repo or cleaning up your own team's codebase, Git Visualizer can provide clarity into commits, ownership, timing and relationships.
Git Visualizer Features
Features
- Interactive graph visualization of Git repository history
- View commit history, branches, merges
- Filter history by date range, author, files changed
- Compare branches and commits
- Export graph as PNG image
Pricing
- Open Source
Pros
Cons
Official Links
Reviews & Ratings
Login to ReviewThe Best Git Visualizer Alternatives
View all Git Visualizer alternatives with detailed comparison →
Top Development and Version Control and other similar apps like Git Visualizer
Here are some alternatives to Git Visualizer:
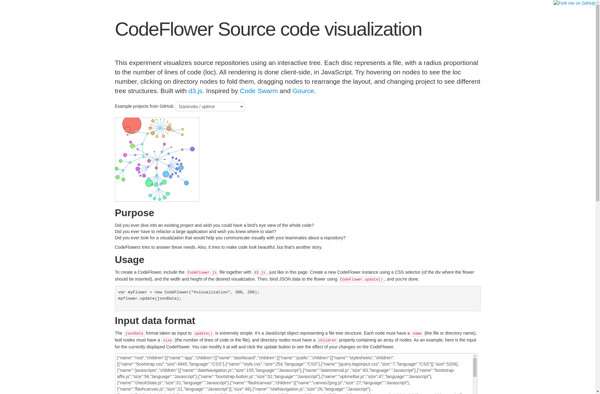
Suggest an alternative ❐CodeFlower
Gource

Github Visualize

GitHub Visualizer

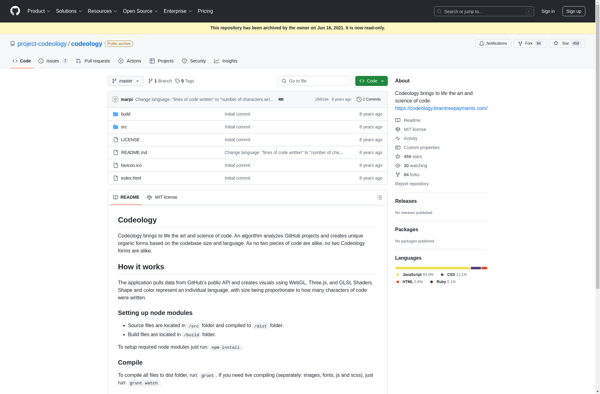
Codeology