Struggling to choose between Grafana and Hosted Graphite? Both products offer unique advantages, making it a tough decision.
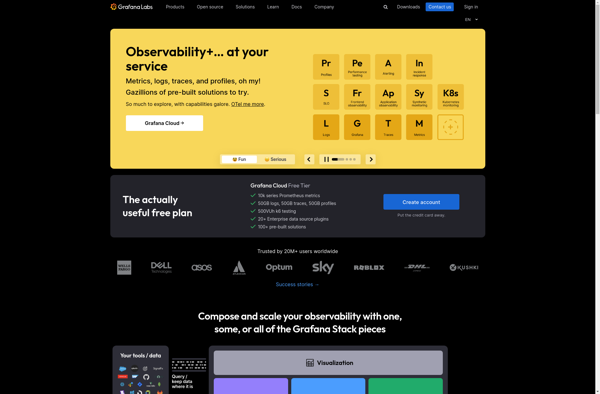
Grafana is a Ai Tools & Services solution with tags like analytics, monitoring, visualization, dashboard.
It boasts features such as Visualization of time series data, Support for multiple data sources, Annotation and alerting capabilities, Dashboard creation and sharing, Plugin ecosystem for extensibility and pros including Open source and free, Powerful and flexible visualization, Wide range of data source integrations, Active community support.
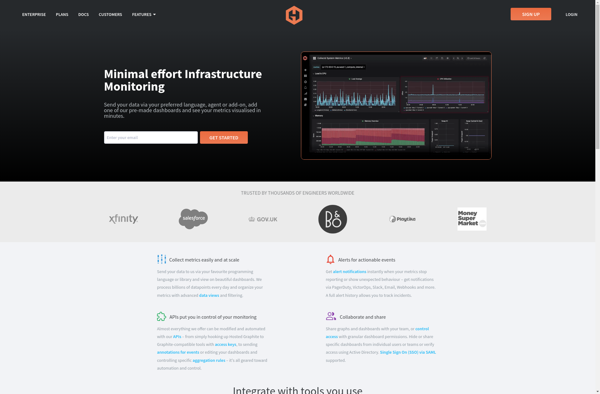
On the other hand, Hosted Graphite is a Online Services product tagged with metrics, monitoring, visualization, timeseries, dashboard.
Its standout features include Real-time graphing and dashboarding, Alerting and anomaly detection, Metrics storage and retention policies, REST API for automation and integration, Role-based access control and permissions, White-labeling and branding options, and it shines with pros like Easy to set up and use, Scalable and reliable data collection, Pre-built integrations and plugins, Customizable dashboards and graphs, Available as SaaS or self-hosted.
To help you make an informed decision, we've compiled a comprehensive comparison of these two products, delving into their features, pros, cons, pricing, and more. Get ready to explore the nuances that set them apart and determine which one is the perfect fit for your requirements.
Grafana is an open source analytics and monitoring visualization tool. It allows you to query, visualize, alert on and understand metrics from various data sources like Prometheus, Elasticsearch, Graphite, and more. Grafana makes it easy to create dashboards with drilling down capabilities as well as share visualizations with non-technical team members.
Hosted Graphite is a cloud-based monitoring tool for analyzing time-series metrics and data. It offers real-time graphing, dashboarding, alerts, and anomaly detection for observability of applications and infrastructure.