GraphUp
Description: GraphUp is a data visualization and analytics software that allows users to easily create interactive charts, graphs, and dashboards to visualize complex data. It has a user-friendly drag and drop interface to build visualizations quickly without coding.
Type: software
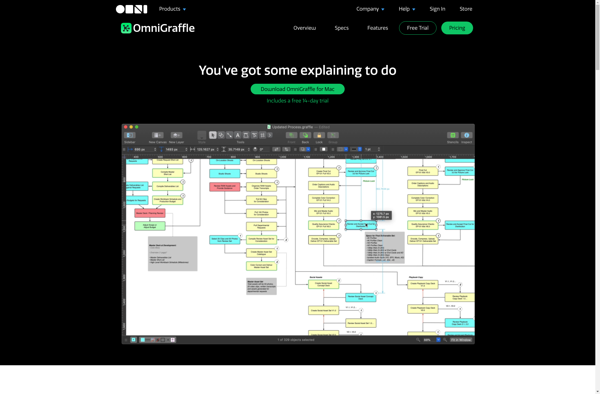
OmniGraffle
Description: OmniGraffle is a diagramming and graphic design application for macOS and iOS. It allows users to create everything from simple diagrams to complex illustrations and prototypes. OmniGraffle enables intuitive diagramming with customizable canvases, templates, stencils, and tools for drawing, connecting objects, and styling diagrams.
Type: software