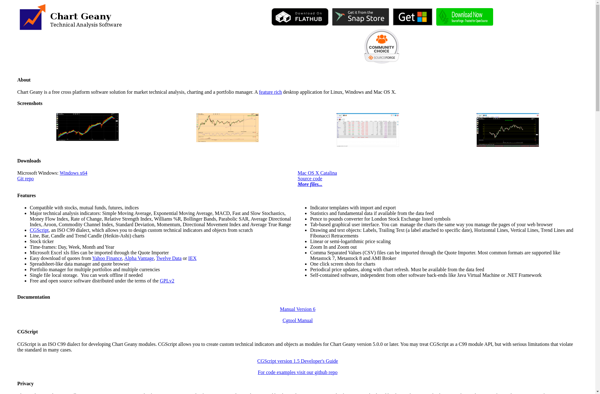
Chart Geany
Description: Chart Geany is an open-source, cross-platform data visualization and charting software. It allows users to create a wide variety of charts and graphs to visualize data, including line, bar, pie, scatter plots, and more. Key features include drag-and-drop interface, customizable themes, and export options.
Type: software
Pricing: Open Source
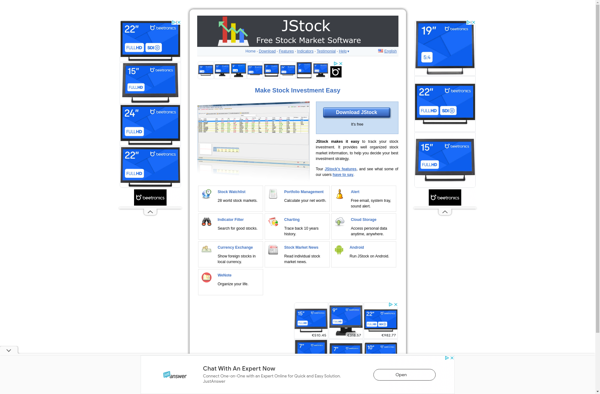
JStock
Description: JStock is an open-source stock market monitoring and charting software for Windows, Linux and Mac. It allows users to track stocks, futures, indices, currencies as well as portfolio values. Key features include customizable watchlists, indicators, alerts, portfolio management, news feeds and global market data coverage.
Type: software
Pricing: Open Source