Chart Geany
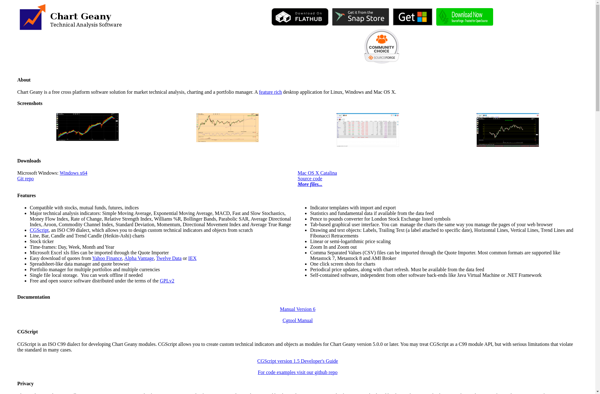
Chart Geany: Open-Source Data Visualization Software
Discover the powerful data visualization tool Chart Geany, an open-source solution for creating interactive charts and graphs across all platforms.
What is Chart Geany?
Chart Geany is a free, open-source data visualization and charting tool available for Windows, Mac, and Linux. It provides an intuitive drag-and-drop interface that allows users to easily create a wide variety of charts and graphs to visualize data, without needing to know programming or charting syntax.
With Chart Geany, users can create charts including line charts, bar charts, pie charts, scatter plots, area charts, heat maps, and more. It supports importing data from CSV files, Excel spreadsheets, and other sources. Users can customize chart colors, fonts, gridlines, and other design elements using the built-in themes or by manually tweaking chart formatting options.
Key features include:
- Drag-and-drop workflow for constructing charts
- Multiple chart types including lines, bars, pies, scatter plots
- Import data from CSV, Excel, JSON files
- Real-time chart updates when data changes
- Customizable themes and chart formatting options
- Annotations and notes can be added to charts
- Export charts as image files or inject reusable chart code into apps
- Open-source program customizable via plugins
Chart Geany aims to provide an intuitive yet flexible data visualization solution for analysts, developers, academics, marketers, and anyone who needs to create charts and graphs for data analysis and presentation. Its easy-to-use interface makes chart creation accessible for beginners while also offering advanced functionality for more experienced users.
Chart Geany Features
Features
- Drag-and-drop interface
- Wide variety of chart types
- Customizable themes
- Export charts as images or PDFs
- Cross-platform compatibility
Pricing
- Open Source
Pros
Cons
Official Links
Reviews & Ratings
Login to ReviewThe Best Chart Geany Alternatives
Top Data Visualization and Charting and other similar apps like Chart Geany
Here are some alternatives to Chart Geany:
Suggest an alternative ❐AmiBroker
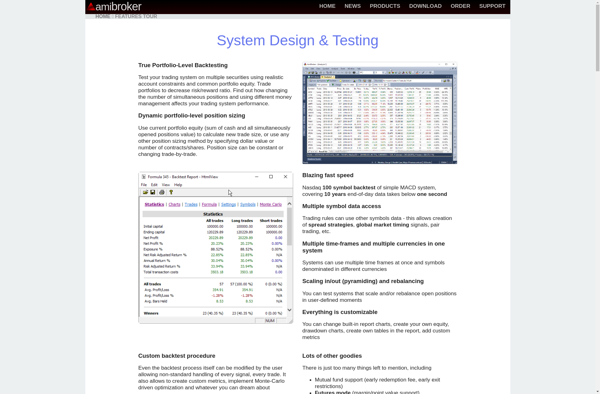
MetaStock

Portfolio Performance
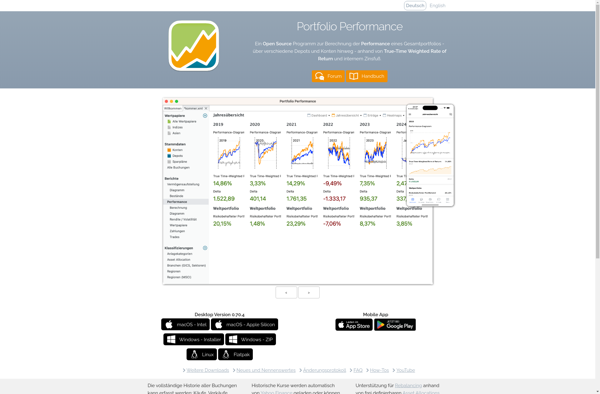
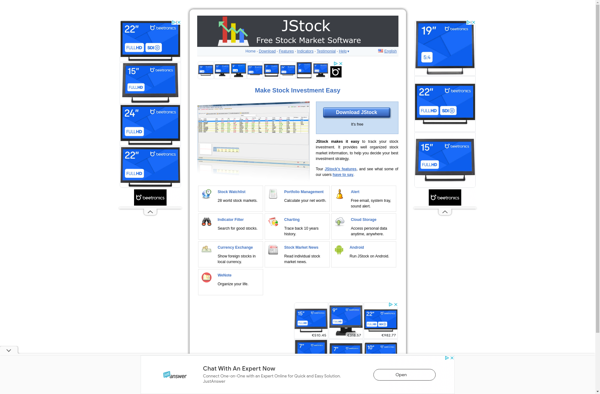
JStock
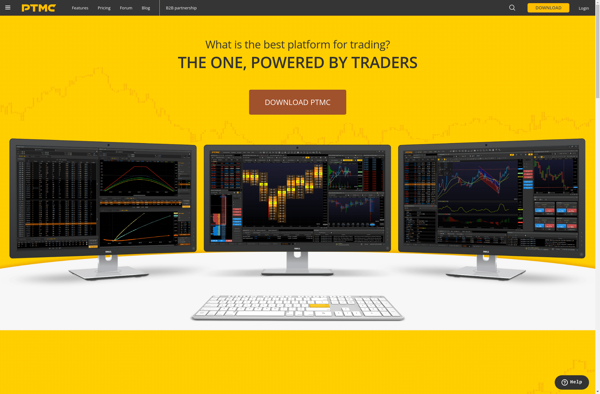
PTMC
Ghostfolio

TraderStar

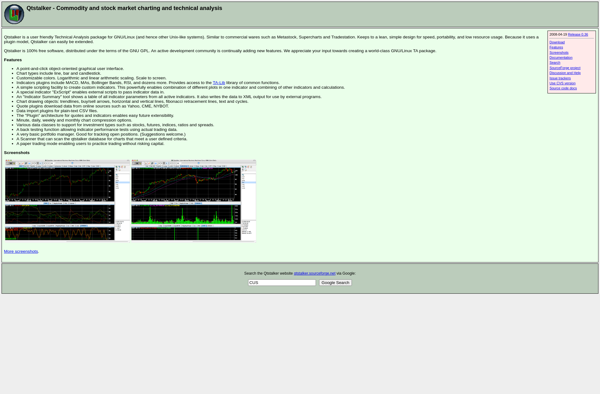
Qtstalker
ProRealTime

QChartist
Market Analyst
