Market Analyst

Market Analyst

Market Analyst is business intelligence and data visualization software used by market research professionals to analyze survey data. It helps create interactive reports, charts, dashboards, and presentations to uncover insights.
Market Analyst image
data-visualization market-research survey-analysis dashboards presentations

Market Analyst: Business Intelligence & Data Visualization

Business intelligence and data visualization software used by market research professionals to analyze survey data, create interactive reports, charts, dashboards, and presentations to uncover insights.

What is Market Analyst?

Market Analyst is a powerful business intelligence and data visualization platform designed specifically for market research professionals. It enables users to easily import, analyze, and visualize complex survey data to generate actionable insights.

With Market Analyst, researchers can:

  • Import and combine data from any source including SPSS, Excel, tabs, etc.
  • Analyze survey data using a full range of analytical techniques from basic statistics to advanced multivariate analysis.
  • Create compelling interactive reports, charts, dashboards and presentations that help uncover key insights.
  • Easily share findings with colleagues and clients in a secure environment.
  • Scale analysis across the entire organization with comprehensive collaboration features.

The platform provides an intuitive, drag-and-drop interface making it easy for novices and advanced users alike to uncover rich insights. Market Analyst connects directly to source data so analyses are always up-to-date. The software leverages in-memory analytics to handle large complex data sets with speed.

With Market Analyst, market research teams can work more efficiently, analyze faster, and uncover deeper insights to inform strategic decisions.

Market Analyst Features

Features

  1. Data visualization
  2. Interactive dashboards
  3. Automated reporting
  4. Survey data analysis
  5. Data modeling
  6. Data filtering
  7. Collaboration tools

Pricing

  • Subscription-Based
  • Custom Pricing

Pros

Intuitive drag-and-drop interface

Powerful analytics and calculations

Customizable and interactive visualizations

Automates repetitive tasks

Integrates with other systems

Collaboration features

Cons

Steep learning curve

Can be expensive for smaller teams

Limited custom coding options

Requires survey data to analyze

Not ideal for non-market research uses


The Best Market Analyst Alternatives

Top Business & Commerce and Business Intelligence & Analytics and other similar apps like Market Analyst


MetaStock icon

MetaStock

MetaStock is a proprietary stock analysis and charting software developed by Equis International focused on technical analysis. It has been around since the early 1990s and is widely used by retail and institutional traders, investors, market analysts, and portfolio managers for analyzing the financial markets and making trading decisions.Some key...
MetaStock image
JStock icon

JStock

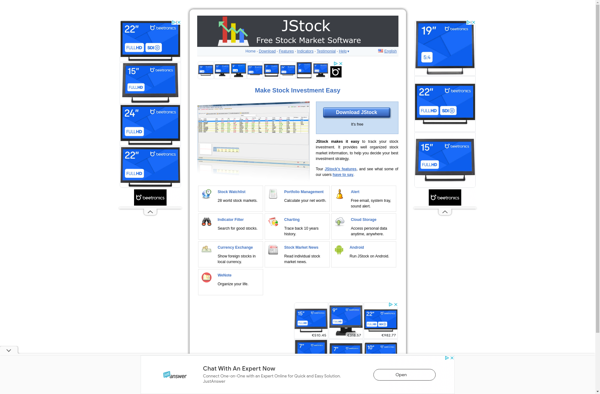
JStock is a feature-rich, open-source stock market monitoring and charting software available for Windows, Linux and Mac operating systems. It enables both casual and serious investors to efficiently track stocks, futures, indices, currencies as well as overall portfolio values.Some of the key features of JStock include:Customizable watchlists to track securities...
JStock image
DR/DNA icon

DR/DNA

DR/DNA is a proprietary disk repair and data recovery software tool for Windows operating systems. It provides a comprehensive set of disk utilities to recover deleted files and folders even if they have been emptied from the Recycle Bin, optimize disk performance, securely erase sensitive data, and fix file system...
DR/DNA image
Ichimoku Ultimate Scanner EA 2020 icon

Ichimoku Ultimate Scanner EA 2020

Ichimoku Ultimate Scanner EA 2020 is an expert advisor for the MetaTrader 4 and MetaTrader 5 forex trading platforms. It is designed to scan the market in real-time and identify potential trading opportunities based on the popular Ichimoku Kinko Hyo technical indicator.The Ichimoku cloud indicator is made up of multiple...
Ichimoku Ultimate Scanner EA 2020 image
TraderStar icon

TraderStar

TraderStar is a comprehensive stock trading and analysis software platform aimed at active traders and investors who require sophisticated market data and analytics. It provides users with real-time, streaming quotes for stocks, options, futures, forex, and cryptocurrencies across major global exchanges.Key features of TraderStar include:Advanced interactive charting with over 100...
TraderStar image
InvestorRT icon

InvestorRT

InvestorRT is a comprehensive stock analysis and portfolio management software solution designed specifically for individual investors. It incorporates a wide range of analytical tools and information to support investment research and decision making.Key features of InvestorRT include:Stock screening - Customizable stock screening based on fundamental data, technical indicators, industry groups,...
InvestorRT image
Qtstalker icon

Qtstalker

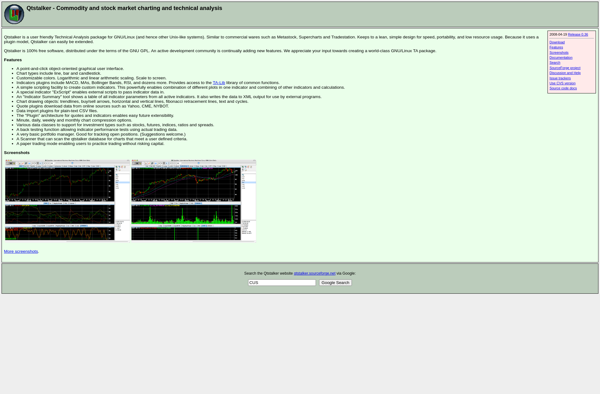
Qtstalker is an open source test automation framework designed specifically for testing Qt-based applications. It provides a rich set of tools to create effective and maintainable automated UI tests.Key features of Qtstalker include:Graphical user interface to create, edit and run automated UI test cases easily without programming.Supports testing desktop, embedded...
Qtstalker image
QChartist icon

QChartist

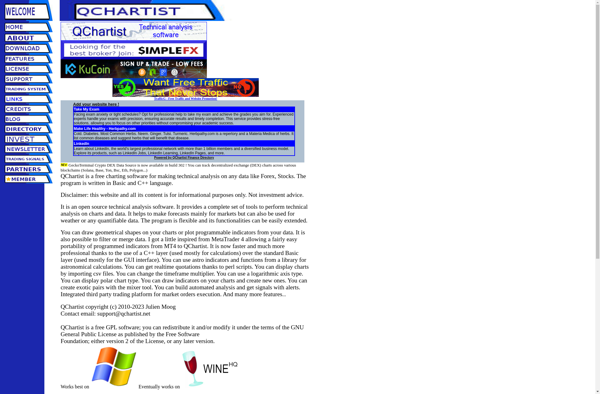
QChartist is a feature-rich JavaScript charting library for building interactive charts and graphs for web applications. It is a Qt/QML wrapper for the popular Chartist.js library that provides additional features and integration with the Qt framework.Some key features of QChartist include:Integration with Qt Quick for animations and touch supportResponsive sizing...
QChartist image
Chart Geany icon

Chart Geany

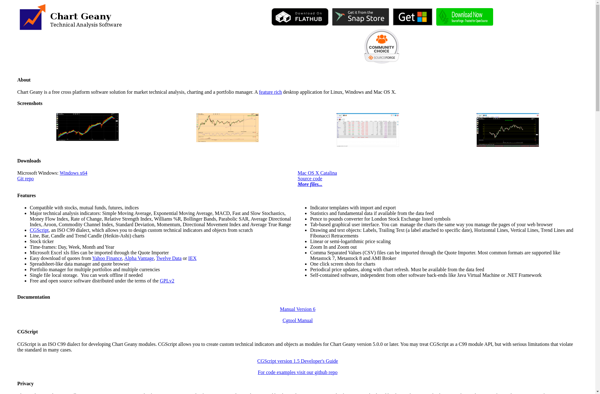
Chart Geany is a free, open-source data visualization and charting tool available for Windows, Mac, and Linux. It provides an intuitive drag-and-drop interface that allows users to easily create a wide variety of charts and graphs to visualize data, without needing to know programming or charting syntax.With Chart Geany, users...
Chart Geany image
Investoscope icon

Investoscope

Investoscope is a comprehensive stock analysis and investment research software designed to help investors make smarter trading and investing decisions. It provides a robust set of features for analyzing stocks, building financial models, creating customizable stock screeners, tracking portfolios, and performing technical and fundamental analysis.Some key features of Investoscope include:Powerful...
Investoscope image
Stock Spy icon

Stock Spy

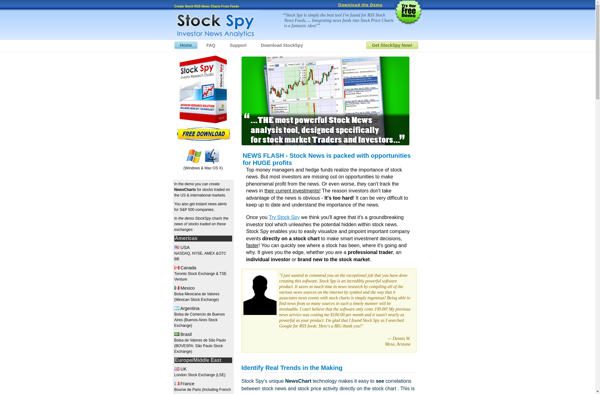
Stock Spy is a comprehensive stock analysis and trading platform designed to help investors make smarter trading decisions. It provides tools to track stock prices, identify trends and patterns, analyze financial reports, create customizable watchlists and alerts, and execute trades.Key features of Stock Spy include:Real-time streaming quotes and interactive charts...
Stock Spy image
ProTA icon

ProTA

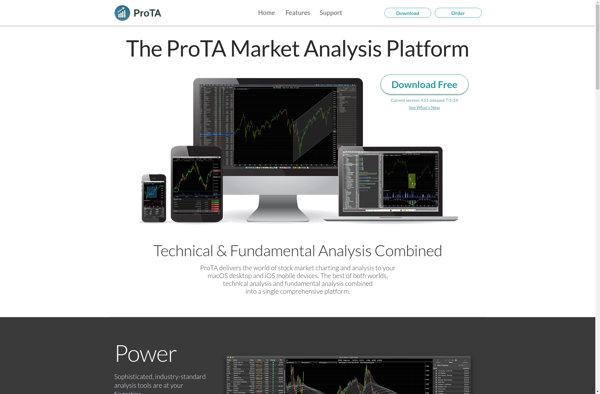
ProTA is an intuitive project and task management application designed for agile software development teams. It provides a suite of features to help plan sprints, break down projects into actionable tasks, track workloads and capacity, manage backlogs, collaborate with team members, and monitor progress and metrics.Some key features of ProTA...
ProTA image
MacStockManager icon

MacStockManager

MacStockManager is a feature-rich stock portfolio management software designed specifically for Mac. It helps investors efficiently track, analyze, and manage their stock investment portfolios right on their Mac computers.Key features include:Portfolio Overview - Get a quick snapshot of your entire portfolio including values, gains/losses, asset allocation charts, top movers, news...
Pro Analyst icon

Pro Analyst

Pro Analyst is a popular business intelligence and analytics platform used by organizations to gain deeper insights from their data. Here are some key capabilities of Pro Analyst:Data Connectivity - Connect to SQL databases, cloud apps like Salesforce, Excel, etc. to access data.ETL Tools - Clean, transform and combine data...
Pro Analyst image
Stox icon

Stox

Stox is an open-source network monitoring and management platform designed to help admins visualize, monitor, and manage their IT infrastructure. Some key features of Stox include:Interactive network topology maps showing how different systems and devices are connectedCustomizable dashboards for visualizing performance metrics and health statusAutomatic discovery of devices and services...
Stox image