Lovely Charts
Description: Lovely Charts is a free chart and diagram creation software for Windows. It provides an easy-to-use interface to create various charts like flowcharts, mind maps, organizational charts, network diagrams, and more. Useful for brainstorming, planning, and data visualization.
Type: software
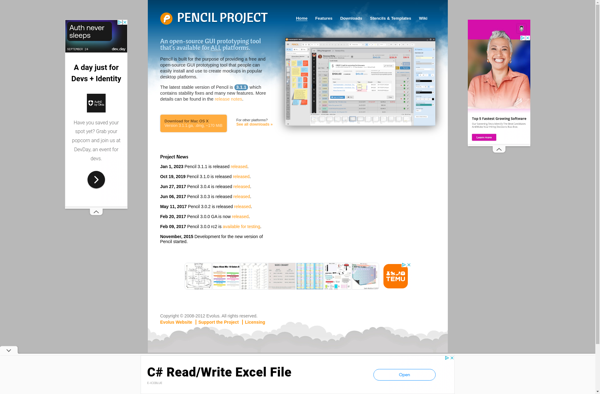
Pencil Project
Description: Pencil Project is a free and open source GUI prototyping and mockup tool. It allows users to create wireframes and prototypes for software interfaces and websites quickly and easily, without programming knowledge.
Type: software
Pricing: Open Source