Iplotz
Description: Iplotz is a free online tool for creating interactive charts, graphs, and data visualizations. It allows users to easily upload datasets and turn them into engaging visuals that can be embedded or shared online.
Type: software
Pricing: Freemium
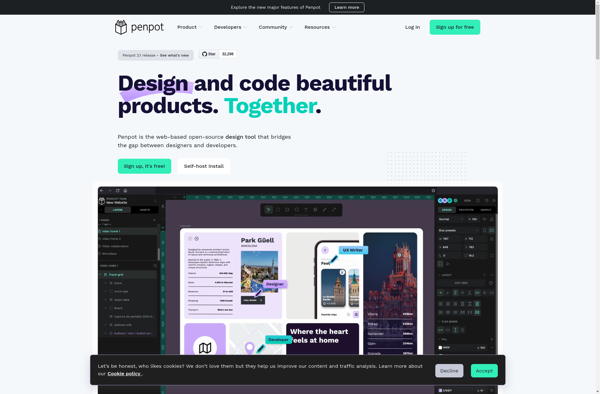
Penpot
Description: Penpot is an open source design and prototyping tool for UI and UX designers. It allows designers to create wireframes, mockups, and prototypes with support for canvas grids, symbols, shared libraries, and sketch imports. Penpot has vector editing capabilities, component libraries, and developer handoff features.
Type: software
Pricing: Open Source