Nagios
Description: Nagios is an open-source monitoring system that allows administrators to monitor network infrastructure like servers, switches, applications, and services. It can notify users when issues arise and help identify problems in a timely manner.
Type: software
Pricing: Open Source
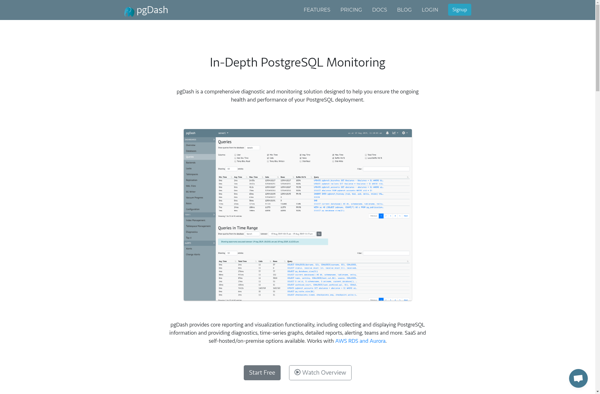
pgDash
Description: pgDash is an open-source web-based dashboard and insights tool for PostgreSQL databases. It provides visualizations, metrics, and query stats to help developers and DBAs monitor and optimize PostgreSQL performance.
Type: software
Pricing: Open Source