Prometheus vs Rollbar

Struggling to choose between Prometheus and Rollbar? Both products offer unique advantages, making it a tough decision.

Prometheus is a Ai Tools & Services solution with tags like monitoring, alerting, metrics.

It boasts features such as Multi-dimensional data model with time series data identified by metric name and key/value pairs, PromQL, a flexible query language to leverage this dimensionality, No reliance on distributed storage; single server nodes are autonomous, Time series collection happens via a pull model over HTTP, Pushing time series is supported via an intermediary gateway, Targets are discovered via service discovery or static configuration, Multiple modes of graphing and dashboarding support and pros including Highly dimensional model allows flexible and efficient queries, PromQL supports aggregation and recording rules for pre-calculation, Built-in alerting and notification routing, Highly available with simple operational model, Native support for Kubernetes, Strong ecosystem integration.

On the other hand, Rollbar is a Development product tagged with error-tracking, exception-handling, debugging, monitoring.

Its standout features include Real-time error and exception monitoring, Stack trace linking and deduplication, Error grouping and analytics, Alerting and notifications, Integrations with Slack, PagerDuty, etc., Server-side and client-side SDKs, Source map support, Customizable error grouping rules, and it shines with pros like Easy and quick setup, Good integration options, Detailed error diagnostics, Flexible pricing options, Good UI and UX.

To help you make an informed decision, we've compiled a comprehensive comparison of these two products, delving into their features, pros, cons, pricing, and more. Get ready to explore the nuances that set them apart and determine which one is the perfect fit for your requirements.

Prometheus

Prometheus

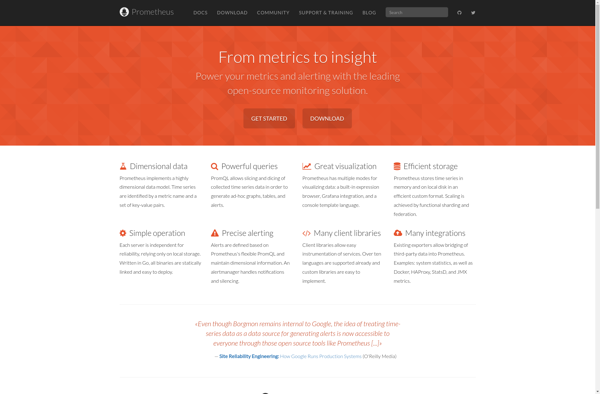
Prometheus is an open-source systems monitoring and alerting toolkit. It collects metrics from configured targets at given intervals, evaluates rule expressions, displays the results, and can trigger alerts if certain conditions are met.

Categories:
monitoring alerting metrics

Prometheus Features

  1. Multi-dimensional data model with time series data identified by metric name and key/value pairs
  2. PromQL, a flexible query language to leverage this dimensionality
  3. No reliance on distributed storage; single server nodes are autonomous
  4. Time series collection happens via a pull model over HTTP
  5. Pushing time series is supported via an intermediary gateway
  6. Targets are discovered via service discovery or static configuration
  7. Multiple modes of graphing and dashboarding support

Pricing

  • Open Source

Pros

Highly dimensional model allows flexible and efficient queries

PromQL supports aggregation and recording rules for pre-calculation

Built-in alerting and notification routing

Highly available with simple operational model

Native support for Kubernetes

Strong ecosystem integration

Cons

Pull-based model can miss short-lived spikes between scrapes

No automatic removal of stale metrics (extra storage usage)

Limited tooling for stats analysis, forecasting, anomaly detection

No built-in federation for massive scale

Steep learning curve for PromQL and architecture


Rollbar

Rollbar

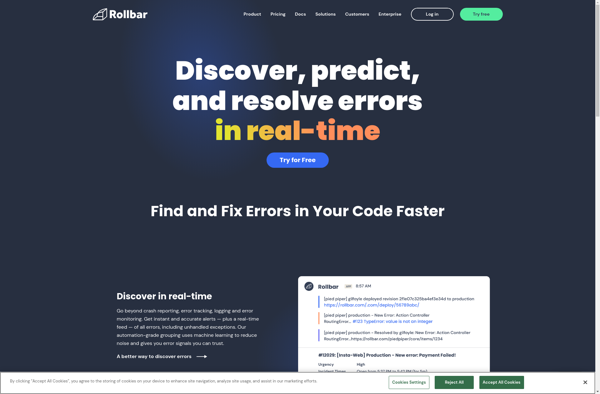
Rollbar is an error and exception tracking and reporting software service for web and mobile applications. It provides real-time error monitoring across client- and server-side applications to identify and resolve issues quickly.

Categories:
error-tracking exception-handling debugging monitoring

Rollbar Features

  1. Real-time error and exception monitoring
  2. Stack trace linking and deduplication
  3. Error grouping and analytics
  4. Alerting and notifications
  5. Integrations with Slack, PagerDuty, etc.
  6. Server-side and client-side SDKs
  7. Source map support
  8. Customizable error grouping rules

Pricing

  • Freemium
  • Subscription-Based

Pros

Easy and quick setup

Good integration options

Detailed error diagnostics

Flexible pricing options

Good UI and UX

Cons

Can get expensive at higher tiers

Limited customization at lower tiers

No log management features

No APM or tracing capabilities