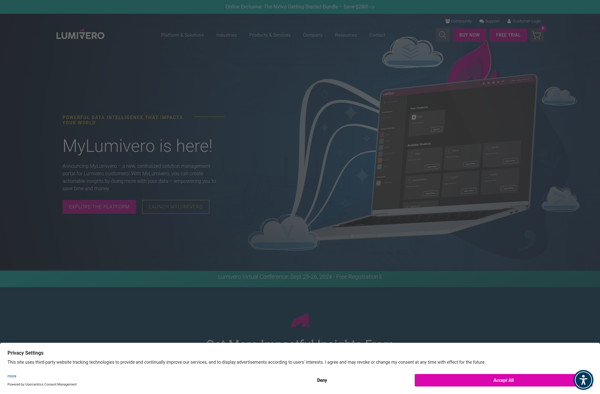
NVivo
Description: NVivo is qualitative data analysis software used by researchers to organize, analyze and find insights in non-numerical or unstructured data like interviews, open-ended survey responses, articles, social media and web content. It allows you to import, classify, code and visualize various data types.
Type: software
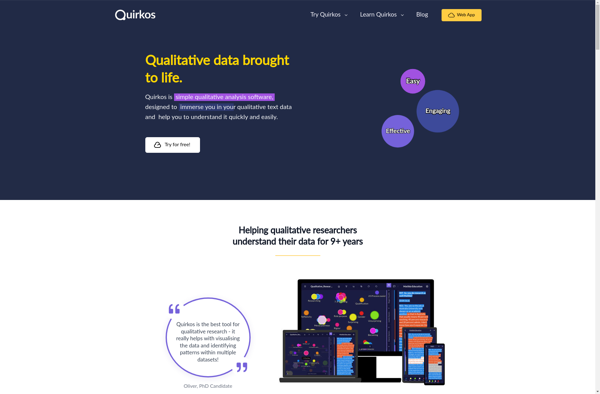
Quirkos
Description: Quirkos is a qualitative data analysis software that allows researchers to easily code, annotate, and analyze interviews, surveys, focus groups, and other text-based data. It has an intuitive drag-and-drop interface for coding and organizing themes.
Type: software