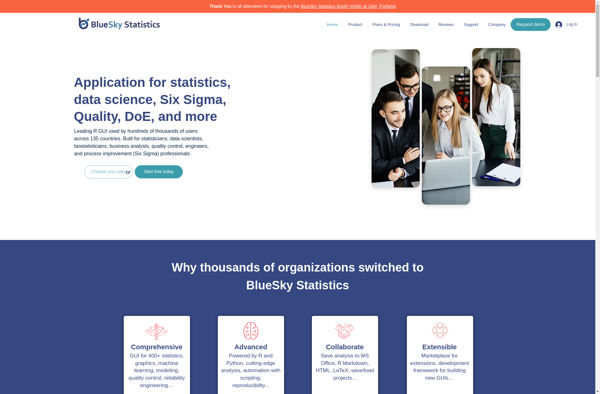
BlueSky Statistics
Description: BlueSky Statistics is an open-source data analysis software that allows users to explore, visualize, and model their data. It features an intuitive graphical user interface, interactive graphics and statistics tools, and the ability to work with large datasets.
Type: software
Pricing: Open Source
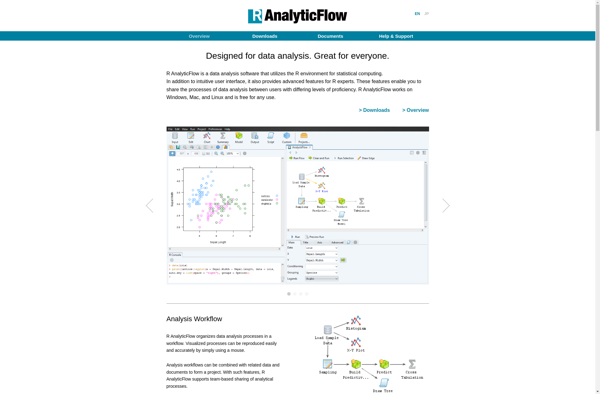
R AnalyticFlow
Description: R AnalyticFlow is an open-source data science platform for R that allows you to create reusable analysis flows and deploy them at scale. It has a code-free GUI for building flows visually as well as integration with Git for version control.
Type: software
Pricing: Open Source