e!Sankey
Description: e!Sankey is free software that allows users to create Sankey diagrams. It has an intuitive graphical user interface that makes it easy for anyone to visualize flows and connections in their data.
Type: software
Pricing: Open Source
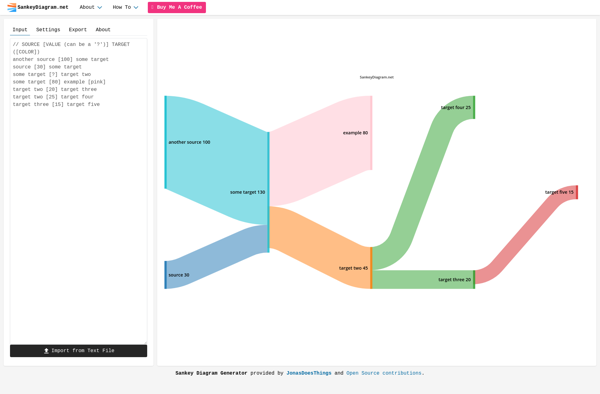
SankeyDiagram.net
Description: SankeyDiagram.net is a free online tool to easily create Sankey diagrams. It allows users to visually map flows between different entities with customizable nodes and links. The interface is intuitive and does not require registration.
Type: software
Pricing: Free