Log Analyzer: Trends
Description: Log Analyzer: Trends is a log analysis tool that specializes in visualizing trends over time in log data. It provides intuitive charts and graphs to help understand usage patterns, performance issues, and more.
Type: software
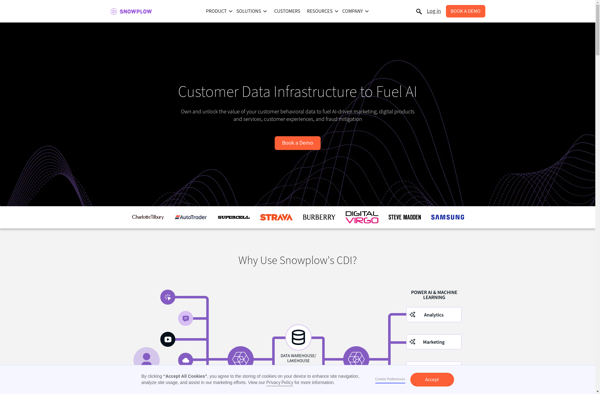
Snowplow Analytics
Description: Snowplow Analytics is an open-source web analytics platform that allows you to collect granular data on user behavior and actions. It empowers you to own and control your data through batch pipeline processing into your own data warehouse.
Type: software
Pricing: Open Source