Photosounder
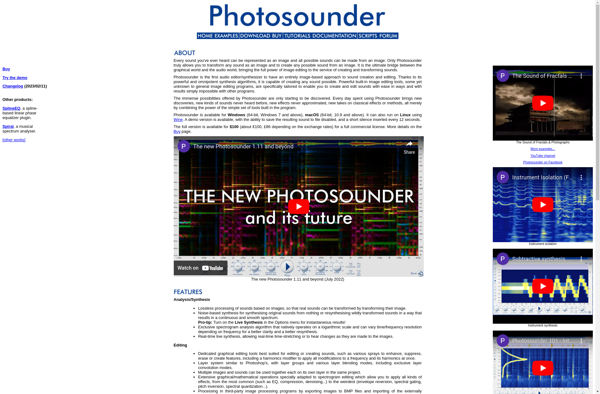
Description: Photosounder is an audio editor that visualizes sound as an image, allowing you to edit audio by painting and modifying images. It can open, edit, and export common audio formats.
Type: software
spectrogram
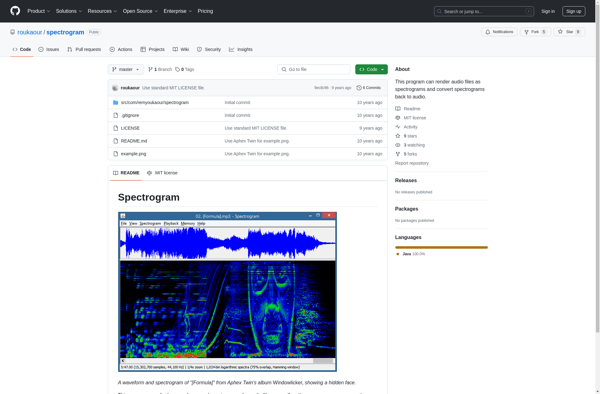
Description: A spectrogram is a visual representation of the spectrum of frequencies in a sound or signal as they vary with time. It is used to analyze the acoustical properties and features of audio.
Type: software
Pricing: Open Source