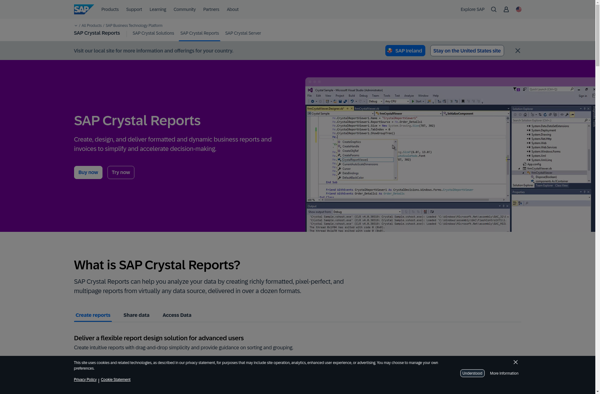
Crystal Reports
Description: Crystal Reports is a business intelligence application used to design and generate reports from a wide range of data sources. It allows users to analyze data and create rich, interactive reports with graphs, charts, and visualizations.
Type: software
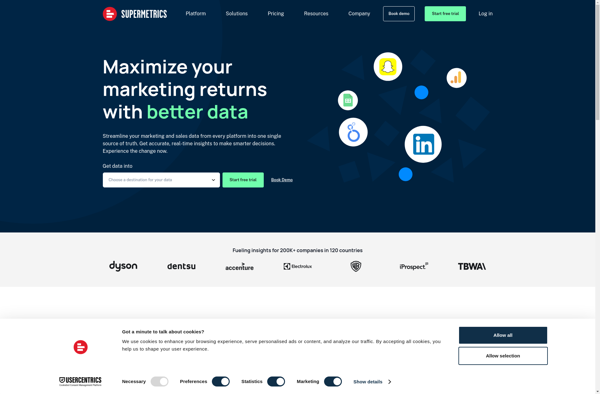
Supermetrics
Description: Supermetrics is a marketing analytics tool that helps users connect their data from different sources like Google Analytics, Facebook Ads, and more. It allows for easy reporting, visualization and analysis across multiple platforms.
Type: software