SystemTap vs ftrace

Struggling to choose between SystemTap and ftrace? Both products offer unique advantages, making it a tough decision.

SystemTap is a Development solution with tags like tracing, diagnostics, linux.

It boasts features such as Dynamic instrumentation of running Linux kernel, Provides visibility into running kernel and user processes, Scripting language for creating probes, Built-in suite of useful scripts and tapsets, CLI and GUI for running scripts and pros including Powerful diagnostics and troubleshooting, No need to recompile or reboot kernel, Tapsets provide reusable instrumentation, Scripting allows custom probes, CLI and GUI interfaces.

On the other hand, ftrace is a System & Hardware product tagged with tracing, debugging, kernel, linux.

Its standout features include Kernel function tracing, Interrupt handler tracing, Scheduling and preemption tracing, Function graph tracing, Customizable events and filters, and it shines with pros like Low overhead, Built into the Linux kernel, Detailed execution tracing, Helpful for debugging and optimization.

To help you make an informed decision, we've compiled a comprehensive comparison of these two products, delving into their features, pros, cons, pricing, and more. Get ready to explore the nuances that set them apart and determine which one is the perfect fit for your requirements.

SystemTap

SystemTap

SystemTap is an open source scripting language and tool for dynamically tracing Linux systems. It provides information about a running Linux system to help diagnose performance or functional problems.

Categories:
tracing diagnostics linux

SystemTap Features

  1. Dynamic instrumentation of running Linux kernel
  2. Provides visibility into running kernel and user processes
  3. Scripting language for creating probes
  4. Built-in suite of useful scripts and tapsets
  5. CLI and GUI for running scripts

Pricing

  • Open Source

Pros

Powerful diagnostics and troubleshooting

No need to recompile or reboot kernel

Tapsets provide reusable instrumentation

Scripting allows custom probes

CLI and GUI interfaces

Cons

Requires debug symbols for kernel modules

Scripting language has learning curve

Overhead from instrumentation

Not all kernel versions supported


ftrace

ftrace

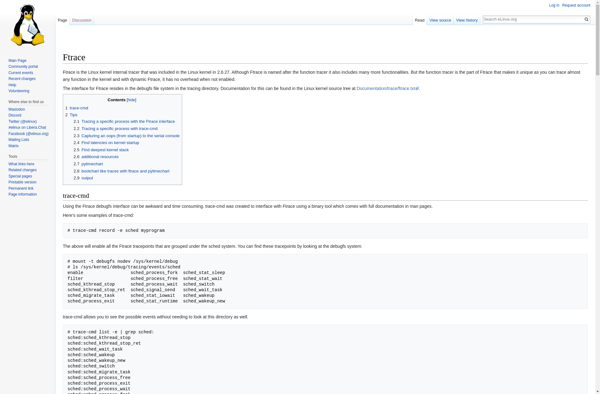
Ftrace is a Linux kernel internal tracer used to observe and debug kernel behavior, including scheduling, function calls, interrupts, and more. It provides detailed execution tracing of the Linux kernel with low overhead.

Categories:
tracing debugging kernel linux

Ftrace Features

  1. Kernel function tracing
  2. Interrupt handler tracing
  3. Scheduling and preemption tracing
  4. Function graph tracing
  5. Customizable events and filters

Pricing

  • Open Source

Pros

Low overhead

Built into the Linux kernel

Detailed execution tracing

Helpful for debugging and optimization

Cons

Can impact performance if tracing unneeded code paths

Requires rebuilding kernel with Ftrace enabled

Somewhat complex configuration