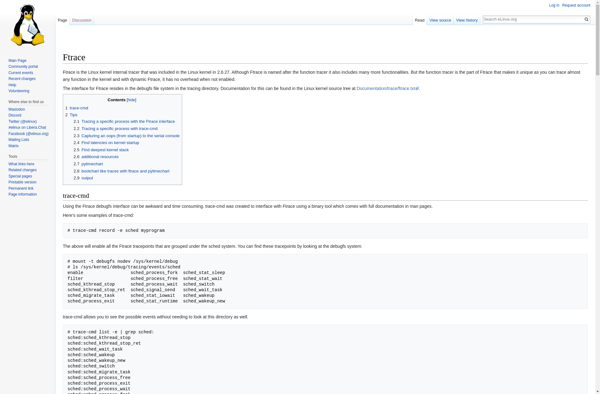
Ftrace
Ftrace: Linux Kernel Tracer
Ftrace is a Linux kernel internal tracer used to observe and debug kernel behavior, including scheduling, function calls, interrupts, and more. It provides detailed execution tracing of the Linux kernel with low overhead.
What is Ftrace?
Ftrace is an internal tracing tool built into the Linux kernel that can be used to observe, analyze, and debug the kernel's behavior and internals in real time. Some of the key things that ftrace can trace include:
- Kernel function calls and execution times
- Interrupt handling
- Scheduling events and latencies
- Memory allocation/freeing
- Disk I/O tracing
Ftrace works by hooking tracepoints inserted in kernel code which fire events that can be collected, filtered, and formatted when tracing is enabled. It is extremely low overhead so it can be left running continuously with minimal impact to system performance.
Some of the key uses of ftrace include debugging kernel issues like crashes, lockups, or performance problems; analyzing scheduling latencies; understanding memory usage; optimizing I/O; and gaining visibility into the kernel's overall behavior during development and testing. Various plugins and frontends are available for ftrace to simplify tracing, analysis, and visualization of the kernel's internals.
Ftrace Features
Features
- Kernel function tracing
- Interrupt handler tracing
- Scheduling and preemption tracing
- Function graph tracing
- Customizable events and filters
Pricing
- Open Source
Pros
Cons
Official Links
Reviews & Ratings
Login to ReviewThe Best Ftrace Alternatives
View all ftrace alternatives with detailed comparison →
Top System & Hardware and System Diagnostics & Monitoring and other similar apps like Ftrace
Here are some alternatives to Ftrace:
Suggest an alternative ❐Process Monitor

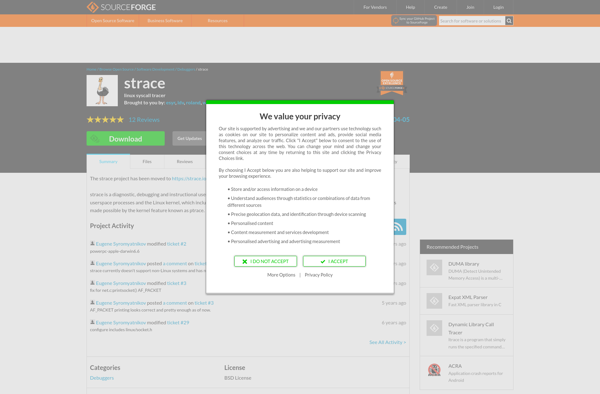
Strace
Ltrace

DTrace

SystemTap