strace is a diagnostic, debugging and instructional userspace utility for Linux. It is used to monitor and tamper with interactions between processes and the Linux kernel, including system calls, signal deliveries, and changes of process state.
A diagnostic tool for Linux, strace monitors interactions between processes and the kernel, tracking system calls, signals, and process state changes.
What is Strace?
strace is a Linux debugging utility that captures and records all system calls made by a process and the signals received by that process. It allows users to troubleshoot issues, monitor interactions between processes and the kernel, and trace program execution in detail.
Some key features and uses of strace include:
Tracing a process and all child processes to log every system call or signal.
Tracking down errors and issues by revealing where in program execution a crash or stall occurs.
Benchmarking and profiling performance by timing system calls and overheads.
Debugging inter-process communication and interactions with the kernel.
Understanding how programs and libraries work internally at a low level.
Instructional tool for learning Linux system call usage and Unix programming concepts.
strace intercepts and records the system calls used, the arguments passed, and the signals received. This low-level information can be extremely useful for in-depth debugging and optimization. It works by tracing the user-kernel boundary, hooking and logging both entry to and exit from the kernel for system calls. The output logs present a high-resolution trace of program execution flow and kernel interactions.
Strace Features
Features
Traces system calls and signals
Intercepts and prints the system calls executed by a program
Displays the values of parameters passed to and returned from system calls
Can attach to an already running process or start a process and trace it
Can trace child processes spawned by a traced process
Pricing
Open Source
Pros
Useful for debugging and troubleshooting programs
Helps identify performance bottlenecks
Lightweight and easy to use
Works on most Linux distributions without needing compilation
Cons
Can slow down execution of traced programs significantly
Generates large trace files quickly
Requires understanding of system calls and signals
Process Monitor is a advanced system monitoring and troubleshooting utility for Windows developed by Sysinternals. It provides a detailed, real-time view of file system, Registry, process, thread and DLL activity on a system.Some key features of Process Monitor include:Monitors process activities like file system, Registry, network, DLL loading/unloading etc. in...
Valgrind is an instrumentation framework for building dynamic analysis tools used to debug and profile Linux executables. It runs programs on a virtual machine and instruments the code at execution time to detect illegal memory accesses, use of uninitialized memory, memory leaks, and threading bugs and race conditions.Some of the...
ltrace is a program tracing utility intended for debugging issues in running processes on Linux and some other Unix-like systems. It intercepts and records dynamic library calls which are called by processes during execution.Specifically, it traces calls made by programs to shared libraries such as system calls and other dynamic...
DTrace is a comprehensive dynamic tracing framework created by Sun Microsystems for troubleshooting kernel and application problems on production systems in real time. It gives administrators, developers, and service personnel a unified interface for concisely answering arbitrary questions about the behavior of the operating system and user programs.Key capabilities of...
Sysdig is an open source troubleshooting and observability platform designed for containers, Kubernetes, and cloud-native infrastructure. It gives developers, SREs, and infrastructure engineers total visibility into applications, microservices, containers, hosts, networks, and public cloud services to monitor, troubleshoot, and secure complex modern environments.Key capabilities and benefits of Sysdig include:Real-time visibility...
API Monitor is a comprehensive API monitoring and testing solution designed for developers and DevOps teams. It provides deep visibility into API performance, user workflows, errors, traffic volume and more to help teams quickly identify and fix issues with APIs and microservices.Key features include:API performance monitoring - Track response times,...
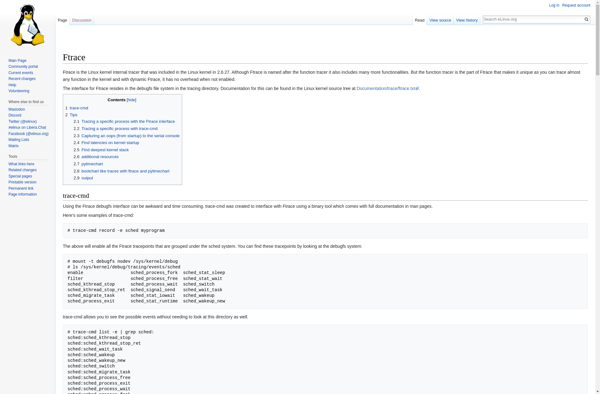
Ftrace is an internal tracing tool built into the Linux kernel that can be used to observe, analyze, and debug the kernel's behavior and internals in real time. Some of the key things that ftrace can trace include:Kernel function calls and execution timesInterrupt handlingScheduling events and latenciesMemory allocation/freeingDisk I/O tracingFtrace...
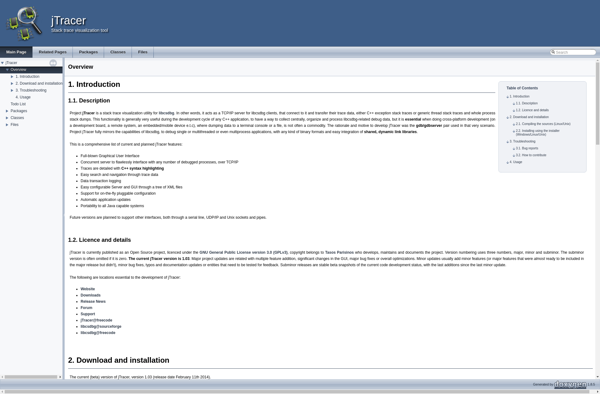
JTracer is an open-source Java profiler and tracing tool designed for monitoring and optimizing the performance of Java applications. It provides detailed runtime information that helps developers identify performance bottlenecks and memory leaks.Key features of JTracer include:CPU and memory profiling to pinpoint expensive methods and leaked objectsMethod-level tracing to understand...
Libcsdbg is an open source debugger library written in C that allows developers to add debugging, tracing, and profiling capabilities to C and C++ programs. It provides a set of APIs and data structures for building custom debuggers, tracers, and profilers.Some key features of Libcsdbg include:Portable across platforms like Linux,...
SystemTap is an open source scripting language and tool for dynamically tracing and monitoring Linux systems. It allows users to collect system information in real time to help diagnose performance or functional problems.Some key features of SystemTap include:Allows for dynamic instrumentation of a running Linux kernel without having to recompile...
ApproveAPI is a cloud-based API and workflow automation platform designed to streamline and automate approval processes for businesses. It allows you to easily build custom approval workflows with configurable rules, notifications, and integrations without writing any code.Some key features of ApproveAPI include:Drag-and-drop workflow builder to visually map out approval chainsCustomizable...