JTracer is an open-source Java profiler and tracing tool for monitoring and optimizing Java application performance. It provides detailed metrics on memory usage, method execution times, and CPU utilization to identify performance bottlenecks.
JTracer: Open-Source Java Profiler and Tracing Tool
JTracer is an open-source Java profiler and tracing tool for monitoring and optimizing Java application performance. It provides detailed metrics on memory usage, method execution times, and CPU utilization to identify performance bottlenecks.
What is JTracer?
JTracer is an open-source Java profiler and tracing tool designed for monitoring and optimizing the performance of Java applications. It provides detailed runtime information that helps developers identify performance bottlenecks and memory leaks.
Key features of JTracer include:
CPU and memory profiling to pinpoint expensive methods and leaked objects
Method-level tracing to understand call sequences and Measure execution times
Thread and monitor profiling to detect threading issues
Built-in benchmarking for load testing
Support for profiling remote Java applications
Integration with popular IDEs like Eclipse, IntelliJ IDEA, and NetBeans
Customizable metrics and reporting
JTracer generates visual graphs and tree-maps that make it easy to understand application behavior. The lightweight agent monitors the JVM without noticeable overhead. Developers can use JTracer to optimize critical paths, eliminate memory bloat, and ensure scalable application performance.
JTracer Features
Features
CPU profiling to identify hotspots
Memory profiling to detect leaks and inefficient usage
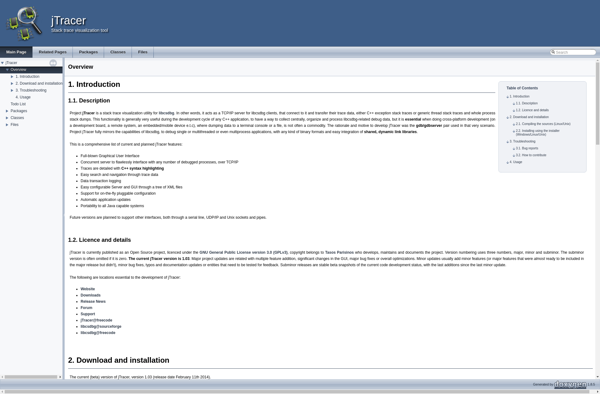
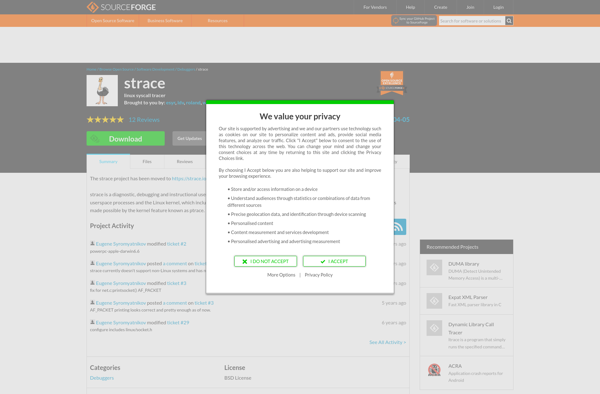
strace is a Linux debugging utility that captures and records all system calls made by a process and the signals received by that process. It allows users to troubleshoot issues, monitor interactions between processes and the kernel, and trace program execution in detail.Some key features and uses of strace include:Tracing...
Valgrind is an instrumentation framework for building dynamic analysis tools used to debug and profile Linux executables. It runs programs on a virtual machine and instruments the code at execution time to detect illegal memory accesses, use of uninitialized memory, memory leaks, and threading bugs and race conditions.Some of the...
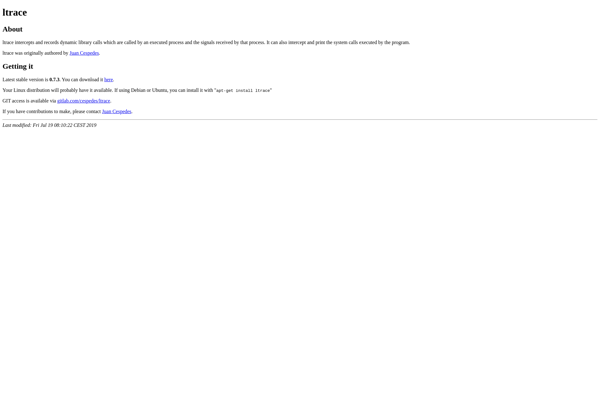
ltrace is a program tracing utility intended for debugging issues in running processes on Linux and some other Unix-like systems. It intercepts and records dynamic library calls which are called by processes during execution.Specifically, it traces calls made by programs to shared libraries such as system calls and other dynamic...
API Monitor is a comprehensive API monitoring and testing solution designed for developers and DevOps teams. It provides deep visibility into API performance, user workflows, errors, traffic volume and more to help teams quickly identify and fix issues with APIs and microservices.Key features include:API performance monitoring - Track response times,...
Kcachegrind is a graphical visualization tool used to analyze profiling data collected from various profilers such as Callgrind, Perf, OProfile, and many more. It helps developers optimize their programs by identifying performance bottlenecks.Some key features of Kcachegrind include:Visualization of call graphs and call stacks to see which functions are taking...
ApproveAPI is a cloud-based API and workflow automation platform designed to streamline and automate approval processes for businesses. It allows you to easily build custom approval workflows with configurable rules, notifications, and integrations without writing any code.Some key features of ApproveAPI include:Drag-and-drop workflow builder to visually map out approval chainsCustomizable...