Kcachegrind
Kcachegrind: Visualization Tool for Profiling Data
Kcachegrind allows analyzing where a program spends its time, both in CPU usage and memory allocation.
What is Kcachegrind?
Kcachegrind is a graphical visualization tool used to analyze profiling data collected from various profilers such as Callgrind, Perf, OProfile, and many more. It helps developers optimize their programs by identifying performance bottlenecks.
Some key features of Kcachegrind include:
- Visualization of call graphs and call stacks to see which functions are taking up the most CPU time.
- Flame graphs to quickly identify hot code paths.
- Assembly level annotations to see which instructions are contributing to CPU usage.
- Cache simulation to analyze cache hits, misses, evictions.
- Memory access profiling to find inefficient memory usage patterns.
The intuitive user interface makes it easy to navigate profiling data sets consisting of hundreds of functions and callers/callees. Developers can dig deeper by filtering and searching based on function names, file locations, process IDs, and more to zoom into areas of interest.
Kcachegrind is included by default in most Linux distributions with KDE desktop or can be installed easily. It integrates well with gdb, gcc, perf tools, and other common developer tools used for profiling. The output can be exported to text, CSV, PDF for sharing analysis with colleagues.
For developers looking to optimize their C, C++, Java, Python applications, Kcachegrind is an essential performance analysis tool to have in their toolkit.
Kcachegrind Features
Features
- Visualize profiling data from various profilers
- View call graphs and callgrind annotations
- Analyze CPU usage and memory allocation
- Navigate between functions and source code
- Compare profiling runs side-by-side
Pricing
- Open Source
Pros
Cons
Reviews & Ratings
Login to ReviewThe Best Kcachegrind Alternatives
View all Kcachegrind alternatives with detailed comparison →
Top Development and Profiling and other similar apps like Kcachegrind
Here are some alternatives to Kcachegrind:
Suggest an alternative ❐Valgrind

WinCacheGrind

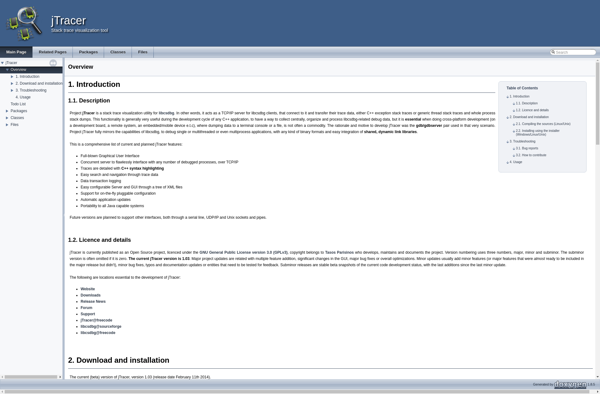
JTracer
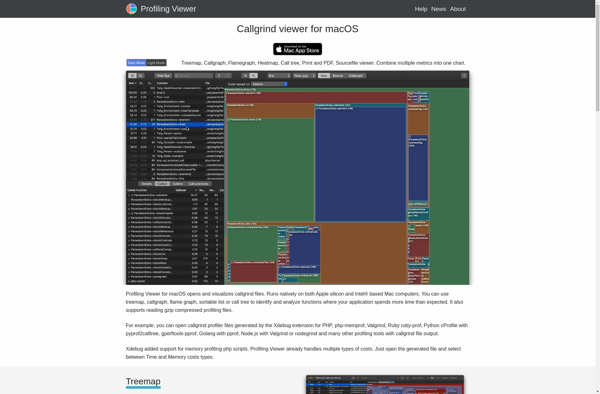
Profiling Viewer