Profiling Viewer
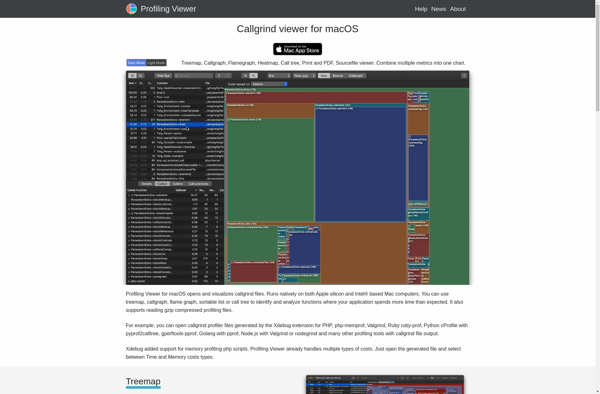
Profiling Viewer: Performance Profiler for Windows
Profiling Viewer is a performance profiling tool for Windows that allows developers to analyze CPU and memory usage of their applications. It visualizes profiling data collected during program execution to identify performance bottlenecks.
What is Profiling Viewer?
Profiling Viewer is a performance profiling tool included in Microsoft Visual Studio on Windows. It allows developers to analyze the CPU and memory usage of their applications to identify performance bottlenecks and opportunities for optimization.
During program execution, the Profiler API instruments functions and collects profiling data like CPU sampler stacks, .NET object allocations, thread contention events, and more. This raw profiling data is complex and hard to interpret.
That's where Profiling Viewer comes in. It processes the raw profiling data and generates interactive timeline graphs and visualization panels. Developers can dig deeper into hot functions, call trees, object lifetimes, and other metrics. Some key features:
- CPU usage analysis to detect high CPU functions
- Memory analysis for managed and native memory
- .NET object allocation tracking and lifetimes
- Thread contention detection
- Compare profiling runs side-by-side
By providing intuitive profiling data visualization, Profiling Viewer makes it easier for developers to optimize their .NET and C++ applications for faster performance.
Profiling Viewer Features
Features
- CPU and memory usage profiling
- Visualization of profiling data
- Identification of performance bottlenecks
- Support for Windows applications
Pricing
- Free
Pros
Cons
Official Links
Reviews & Ratings
Login to ReviewThe Best Profiling Viewer Alternatives
View all Profiling Viewer alternatives with detailed comparison →
Top Development and Performance Testing and other similar apps like Profiling Viewer
Kcachegrind
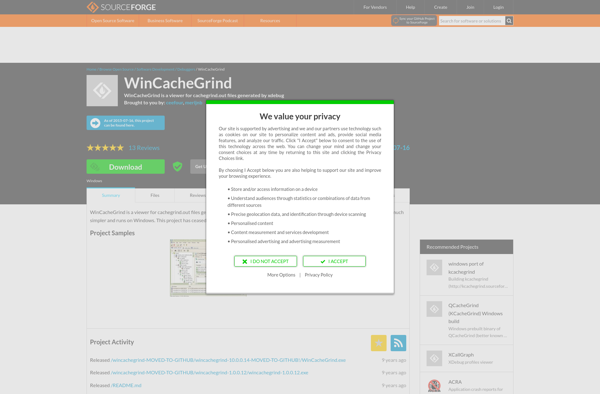
WinCacheGrind