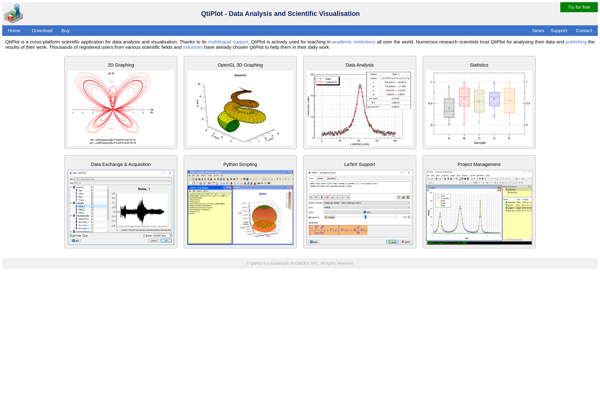
QtiPlot
Description: QtiPlot is an open-source data analysis and visualization software similar to OriginLab Origin software. It offers 2D and 3D plotting, statistical analysis tools, curve fitting, data manipulation, and Python scripting support.
Type: software
Pricing: Open Source
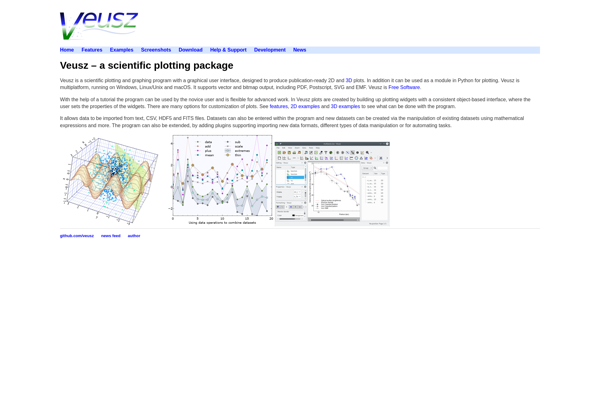
Veusz
Description: Veusz is an open-source scientific plotting and graphing software. It allows users to generate 2D and 3D plots, histograms, contours,vesctor fields and more from data. Veusz is cross-platform and has a GUI for interactive plot generation.
Type: software
Pricing: Open Source