An audio spectrum analyzer is a software tool that displays a visual representation of an audio signal. It shows the amplitude and frequency of audio over time, allowing users to visualize and analyze audio files or live input.
Audio Spectrum Analyzer: Visualize and Analyze Audio Files
An audio spectrum analyzer is a software tool that displays a visual representation of an audio signal. It shows the amplitude and frequency of audio over time, allowing users to visualize and analyze audio files or live input.
What is Audio Spectrum Analyzer?
An audio spectrum analyzer is a software tool used to visualize an audio signal and analyze its amplitude, frequency, and other characteristics over time. It displays a graph showing the signal's frequency spectrum, with amplitude on the vertical axis and frequency on the horizontal axis.
This allows users to see a visual representation of the different frequencies that make up the audio at any given moment. The changing graph moves along the time axis in sync with the audio playback, creating a scrolling spectrogram showing how the signal changes dynamically. Some key features and uses of audio spectrum analyzers include:
Studying how different instruments, noises or voices are distributed across the audible frequency range
Identifying issues in audio signals like unwanted peaks or filtering that may need correction
Understanding what frequencies are most dominant in a given audio track
Mixing and mastering audio, by identifying clashing frequencies or problem spots between tracks
Analyzing room acoustics by visualizing resonances and standing waves
Testing audio equipment like equalizers, crossovers, or speaker performance across different frequencies
Whether working with music production, acoustics, electronics, or other audio applications, a spectrum analyzer is a versatile tool for gaining deeper insight into an audio signal. Modern software analyzers provide detailed, customizable views to suit different analysis needs.
Audio Spectrum Analyzer Features
Features
Real-time audio spectrum analysis
Customizable display with various visualization modes
Support for a wide range of audio file formats
FFT-based frequency analysis
Decibel (dB) and frequency scaling
Waterfall and spectrogram displays
Zoom and panning functionality
Cursor tools for precise measurements
Export options for data and images
Pricing
Free
Freemium
One-time Purchase
Subscription-Based
Pros
Provides detailed analysis of audio signals
Useful for audio engineering, music production, and acoustic analysis
Customizable interface and display options
Supports a variety of input sources, including live input
Offers advanced analysis features like FFT and decibel scaling
Cons
Steep learning curve for beginners
Some advanced features may require technical knowledge
Limited support for real-time analysis of high-resolution audio
Potential performance issues on older or less powerful systems
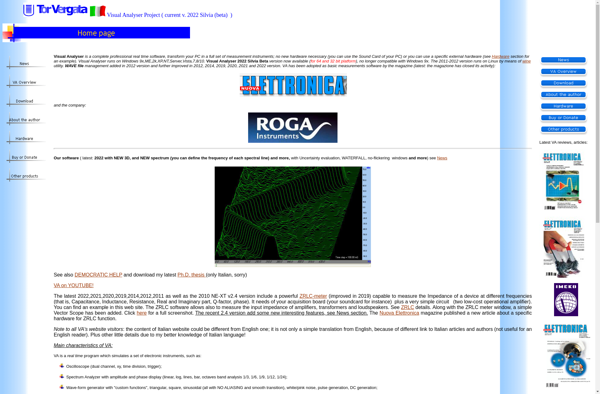
Visual Analyser is a powerful yet easy-to-use data visualization and analytics platform for gaining valuable insights from data. With its intuitive drag-and-drop interface, Visual Analyser makes it simple for anyone to connect to data sources, create interactive dashboards and charts, and share analytics content.Key features and capabilities include:Interactive dashboards with...
Spectroid is a real-time audio spectrum analyzer application for Android devices. It features a customizable spectrogram view showing frequency content over time, as well as a waveform view to see the amplitude envelope. Spectroid is useful for:Tuning musical instruments - The spectrogram view makes it easy to identify harmonic overtones...
WaveSpectra is an open-source software package designed specifically for spectral wave modeling and wave energy resource assessment tools. It enables users to analyze and simulate offshore wave climatology and power at high resolution in order to evaluate and optimize the performance of different wave energy conversion (WEC) systems designs at...
Signalizer is an open-source project management and collaboration tool similar to Monday.com. It provides a variety of features to help teams plan, organize, and track work:Kanban boards for visualizing work and workflowsTasks with statuses, assignments, dates, comments, attachments, and moreCalendars and Gantt charts for scheduling and timeline visualizationReal-time chat and...
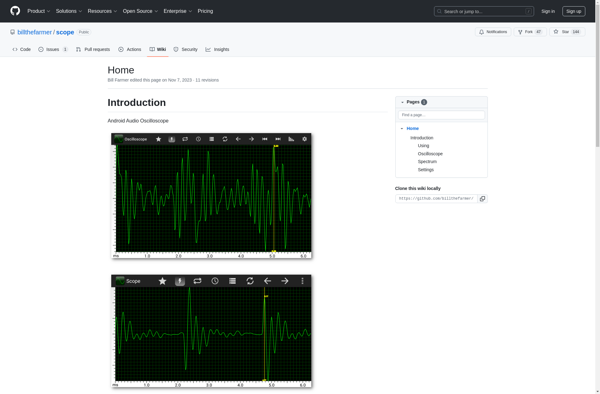
An oscilloscope is an electronic test instrument that allows observation and measurement of constantly varying signal voltages, usually as a two-dimensional graph of one or more electrical potential differences or voltages as a function of time. Oscilloscopes are commonly used to observe the exact wave shape of an electrical signal...
Audizr is an open-source cross-platform audio player and music library management application. Developed as an alternative to proprietary software like iTunes, Audizr aims to provide a free option for listening, organizing and enjoying digital music collections.Key features of Audizr include:Playing local audio files in formats like MP3, FLAC, Ogg Vorbis,...
Spectralissime is a free, open source audio editor and spectral analyzer software for Windows, Mac and Linux. It provides a simple but powerful interface for editing, analyzing and visualizing audio spectra.With Spectralissime you can perform basic audio editing tasks like trimming, fading, normalize volume and more. It also allows you...
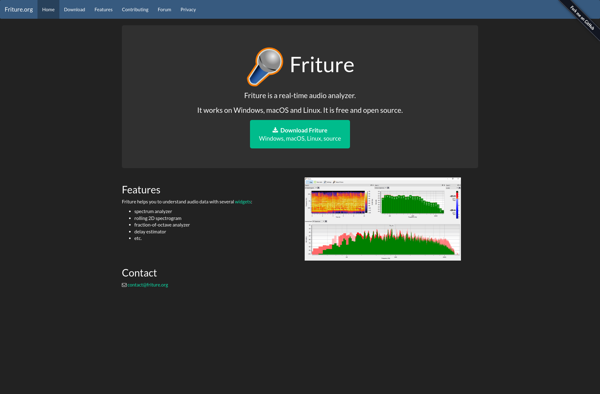
Friture is an open-source application for real-time audio analysis on Linux. It provides a wide range of visualization tools to give detailed insights into audio input from a microphone or sound device.Some of the key features of Friture include:Real-time fast Fourier transform (FFT) spectrum analyzerSpectrogram with logarithmic frequency scaleRolling 2D...
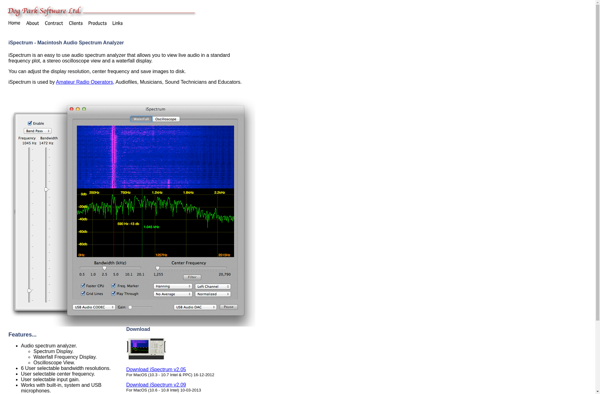
iSpectrum is a feature-rich software tool for audio analysis and editing on Windows platforms. It enables real-time visualization of the frequency spectrum of audio signals from various input sources such as microphones, line-in connections, or audio files.Key features of iSpectrum include:Real-time FFT spectrum analysis with variable FFT sizes up to...