Oscilloscope
Oscilloscope: Observe Electric Signals
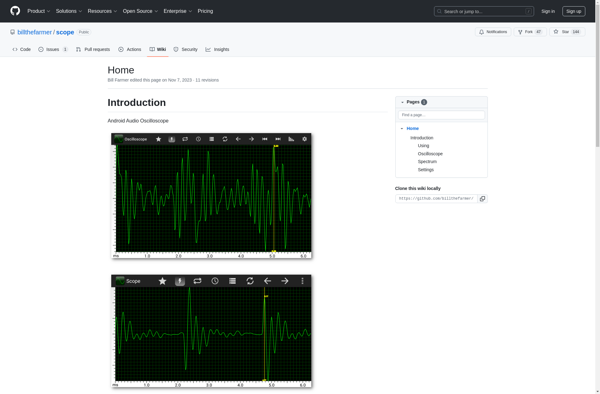
An oscilloscope is a type of electronic test instrument that allows observation of constantly varying signal voltages, usually as a two-dimensional plot of one or more signals as a function of time. Oscilloscopes are commonly used to observe the exact wave shape of an electrical signal over a defined period of time.
What is Oscilloscope?
An oscilloscope is an electronic test instrument that allows observation and measurement of constantly varying signal voltages, usually as a two-dimensional graph of one or more electrical potential differences or voltages as a function of time. Oscilloscopes are commonly used to observe the exact wave shape of an electrical signal over a defined period of time. The observed waveform can be analyzed for properties such as amplitude, frequency, rise time, time interval, distortion, and others.
Modern oscilloscopes display the voltage on the vertical axis and the time on the horizontal axis. Storage oscilloscopes can show single events while analog oscilloscopes and digital phosphor oscilloscopes show repetitive waveforms. Oscilloscopes vary in cost from a few hundred to tens of thousands of dollars depending on the bandwidth, sampling rate, memory depth and advanced triggers.
Oscilloscopes are used in the sciences, medicine, engineering, automotive and the telecommunications industry. General-purpose instruments are used for maintenance of electronic equipment and laboratory work. Special-purpose oscilloscopes may be used for such purposes as analyzing an automotive ignition system or to display the waveform of the heartbeat as an electrocardiogram.
Before the advent of digital electronics, oscilloscopes used cathode ray tubes to display data. After digital oscilloscopes became the norm, the cathode ray versions came to be known as analog oscilloscopes to distinguish them from the fully digital kind. Cathode ray types are now only of historical interest.
Oscilloscope Features
Features
- Waveform display
- Trigger options
- Time base control
- Voltage measurement
- Cursor tools
- Math functions
- Spectrum analysis
- Automatic measurements
- Zoom and panning
- Multiple channel support
Pricing
- Free
- Freemium
- One-time Purchase
- Subscription-Based
Pros
Cons
Official Links
Reviews & Ratings
Login to ReviewThe Best Oscilloscope Alternatives
View all Oscilloscope alternatives with detailed comparison →
Top System & Hardware and Diagnostic Tools and other similar apps like Oscilloscope
Here are some alternatives to Oscilloscope:
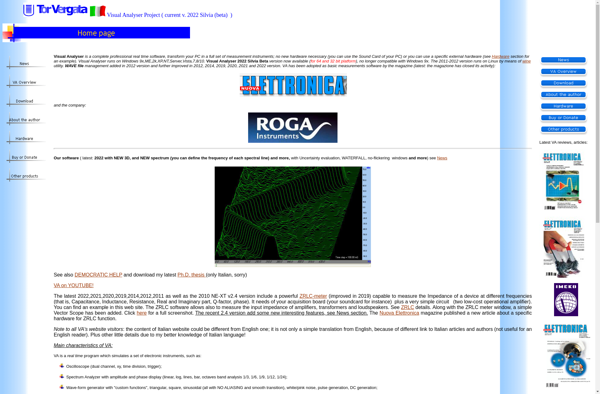
Suggest an alternative ❐Visual Analyser
Spectroid

Audio Spectrum Analyzer

WaveSpectra

Signalizer
Audizr
Spectralissime
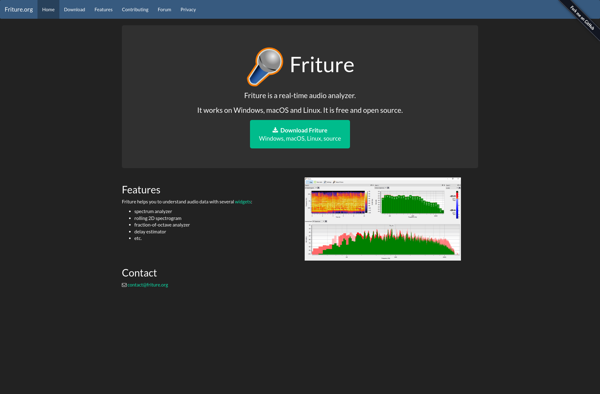
Friture
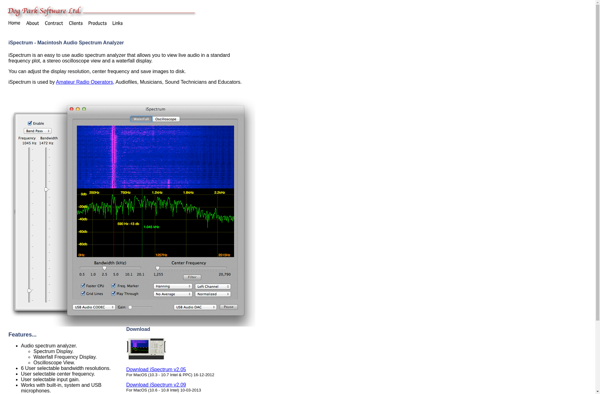
ISpectrum