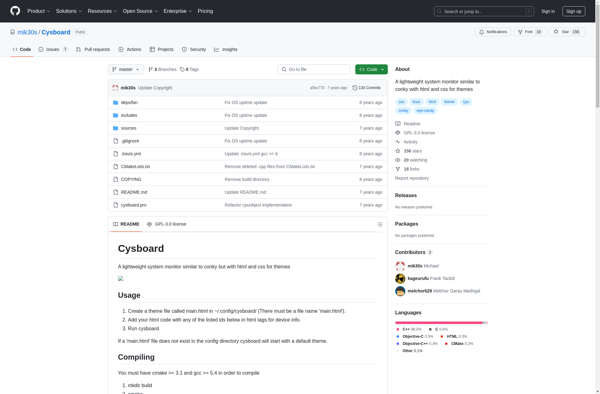
Cysboard is an open-source dashboard and data visualization software built with Python. It allows users to connect to various data sources, build interactive dashboards, and create charts/graphs to gain insights. Key features include drag-and-drop interface, reusable components a
Cysboard: Open-Source Dashboard & Data Visualization Software
Cysboard is an open-source dashboard and data visualization software built with Python. It allows users to connect to various data sources, build interactive dashboards, and create charts/graphs to gain insights. Key features include drag-and-drop interface, reusable components and templates, and support for team collaboration.
What is Cysboard?
Cysboard is an open-source dashboard and data visualization platform for building beautiful, interactive dashboards. It is written in Python and built on top of Plotly Dash framework. Some key features and benefits of Cysboard:
Easy drag-and-drop interface - Design responsive dashboards quickly with drag-and-drop components and automatic layouts, no coding required.
Reusable components and templates - Components and templates make it easy to standardize analytics and accelerate dashboard creation for your organization.
Connect to multiple data sources - Easily connect to SQL, NoSQL databases, REST APIs, Excel, CSV and more data sources to create live dashboards.
Interactive visualizations - Create rich graphs, charts, filters, maps etc. that users can dynamically interact with to uncover insights.
Team collaboration features - Assign permissions, get version control and track changes made by your team members to dashboards.
Open source & extensible - As an open-source project, developers can extend Cysboard by writing custom plugins, themes etc.
With an intuitive interface for building dashboards and rich set of data connectivity & visualization options, Cysboard is a great open-source option for both technical and non-technical teams to create interactive analytics.
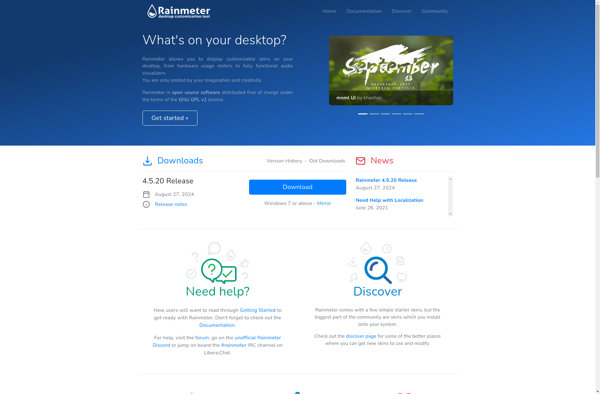
Rainmeter is an open source desktop customization tool for Windows that allows users to personalize their desktop with customizable skins, widgets, and other graphical elements. It provides extensive options for customizing the look and feel of the Windows desktop.Some of the key features of Rainmeter include:Customizable skins and themes -...
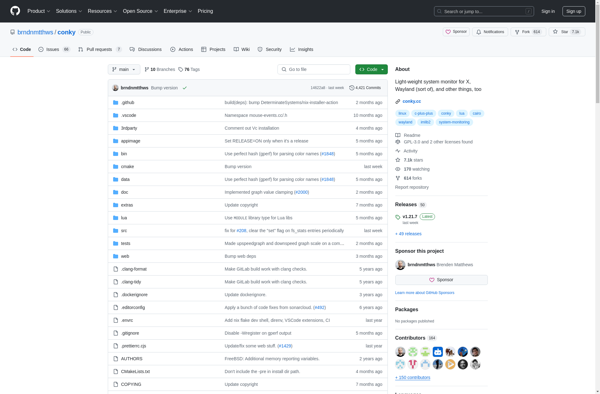
Conky is a free, light-weight system monitor for Linux and BSD operating systems. It displays various system information such as CPU, memory, swap, disk space, temperatures, top processes, network interface speeds, battery levels, email inbox info, and more right on your desktop.Some key features of Conky include:Highly customizable - Conky...
BgInfo is a lightweight system information software designed to display relevant details about a computer system as the desktop background wallpaper. It is free and open-source, originally developed by Sysinternals (acquired by Microsoft).When launched, BgInfo automatically collects key details about the computer such as operating system name and version, CPU...
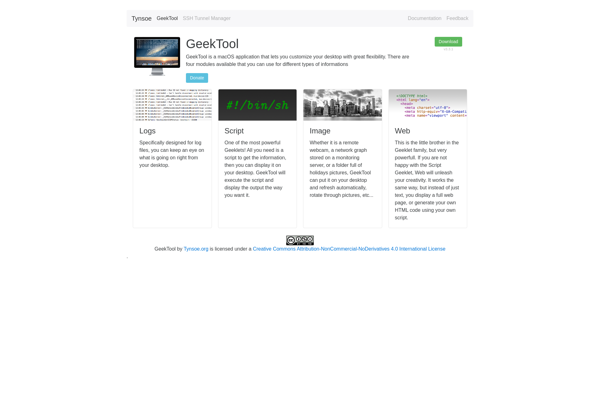
GeekTool is a free, open source application developed for macOS that enables users to customize their desktop with various types of information. It works by allowing users to add shell scripts, images, websites, and other content on the desktop as sprites that automatically update.Some of the information that can be...
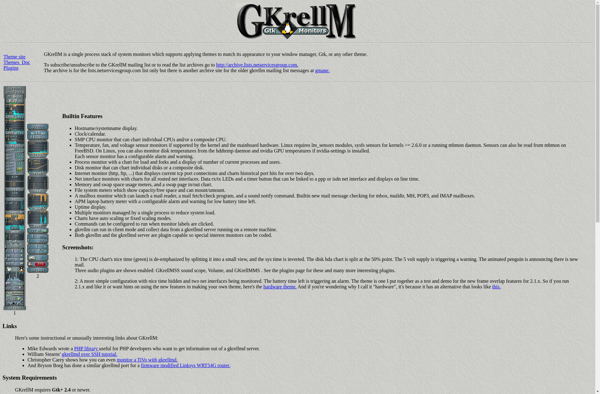
GKrellM is a free, open source system monitoring tool for Linux operating systems. It displays various system metrics and resource usage statistics on a customizable desktop panel, similar to the task manager in Windows.Some of the information GKrellM can monitor and display includes:CPU usage and frequencyMemory and swap usageDisk usage...
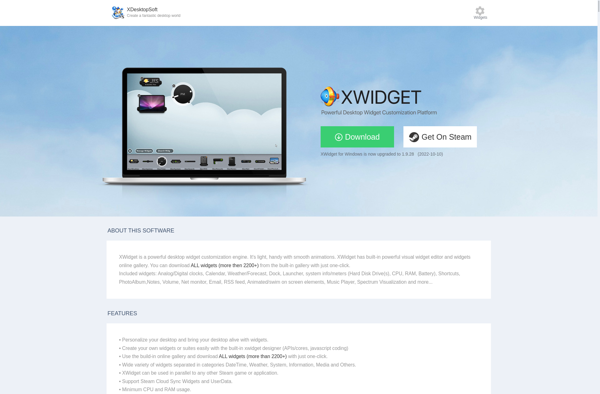
XWidget is a flexible web widget builder that makes it easy for anyone to create customized widgets for their website. It has an intuitive drag-and-drop interface that allows you to pick from a variety of widget types like social media feeds, signup forms, countdown timers, stock tickers, and more.Some key...
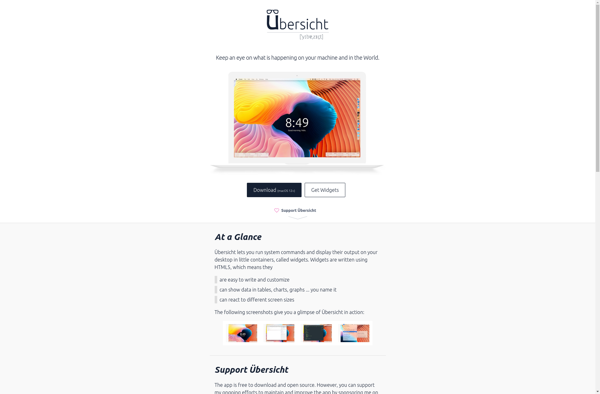
Übersicht is an open-source desktop widget system for Mac OS that allows users to create and run mini web applications and custom widgets on their desktop. It provides an extensible framework that developers can use to build widgets that extend the functionality of the desktop.Some key features of Übersicht include:Lightweight...
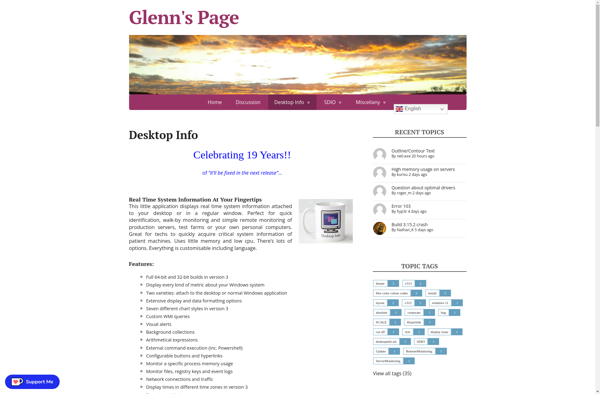
Desktop Info is a free, open source system monitoring utility for Windows that displays important system information directly on the desktop background. This allows users to conveniently monitor their system's performance and resource usage without having to open additional programs.Some of the key information Desktop Info can display includes:CPU usage...
BitBar is a free and open-source application developed for macOS that enables users to customize the menu bar on their Mac with output from any script or program. It provides a simple way to display various types of information in a convenient drop-down menu.Some of the key features of BitBar...
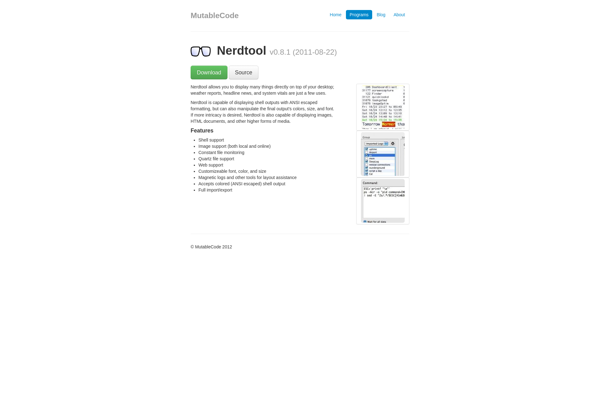
Nerdtool is a feature-rich system utilities and monitoring app designed specifically for macOS. It provides detailed insights into various aspects of your Mac's hardware and software to help debug problems or monitor system resources.Some of the key features of Nerdtool include:CPU monitoring - See real-time CPU usage graphs per core,...
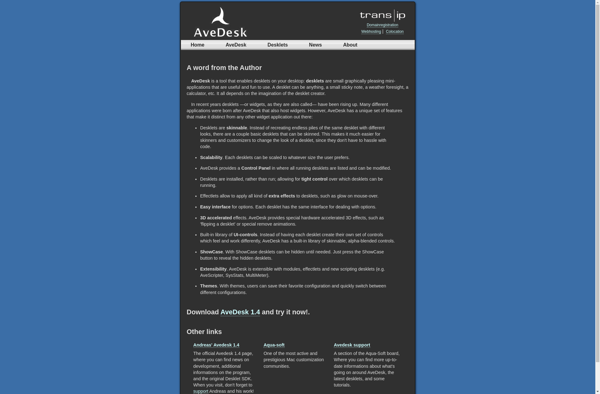
AveDesk is a virtual desktop infrastructure (VDI) solution designed to deliver Windows desktops and applications as a service. It allows organizations to create a virtualized infrastructure that runs desktop operating systems like Windows 10 and apps on servers in a data center, while providing end users access from any device.Some...
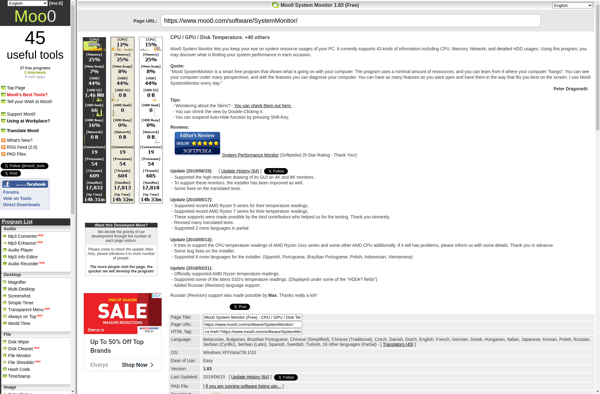
Moo0 System Monitor is a free and open source system monitoring and performance tracking utility for Windows. It provides real-time graphs and statistics on key system resources including CPU usage, memory utilization, network traffic, and disk activity.Some of the key features of Moo0 System Monitor include:Customizable and interactive graphs for...