FitPlot

FitPlot: Open-Source Data Visualization & Curve Fitting
FitPlot is an open-source, cross-platform data visualization and curve fitting application. It allows users to graph and analyze scientific data, perform curve fitting and regression analysis, and generate high-quality publication-ready plots.
What is FitPlot?
FitPlot is an open-source, cross-platform application for interactive scientific data visualization and analysis. It enables researchers, engineers, and analysts to easily import, graph, and analyze measurement data, perform curve fitting and regression analysis, and generate high-quality plots for publications and reports.
Some key features of FitPlot include:
- Intuitive and flexible drag-and-drop interface for graphing multivariate data
- Wide range of 2D and 3D plot types (line, scatter, bar, surface, contour, etc.)
- Powerful curve fitting with a variety of built-in and custom models (linear, polynomial, exponential, Gaussian, etc.)
- Statistical analysis tools like correlations, distributions, confidence bands
- Support for very large datasets with fast plot rendering
- Customizable plots with control over axes, legends, colors, styles
- Export plots in vector and raster formats (SVG, PNG, JPEG, PDF)
- Cross-platform support for Linux, Windows, and Mac OS
- Open-source (GPL license) with C++ and Python APIs for extensibility
With its balance of usability and advanced analytics capabilities, FitPlot is a valuable visualization and analysis tool for engineers, scientists, mathematicians, and programmers working with scientific data across many domains.
FitPlot Features
Features
- Graphing and visualization
- Curve fitting and regression analysis
- Support for multiple graph types (line, scatter, bar, etc)
- Data analysis tools
- Export publication-quality vector graphics
Pricing
- Open Source
Pros
Cons
Official Links
Reviews & Ratings
Login to ReviewThe Best FitPlot Alternatives
View all FitPlot alternatives with detailed comparison →
Top Science & Education and Data Analysis and other similar apps like FitPlot
Here are some alternatives to FitPlot:
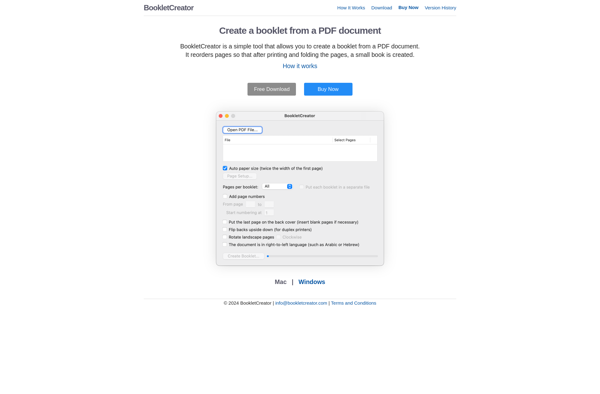
Suggest an alternative ❐BookletCreator
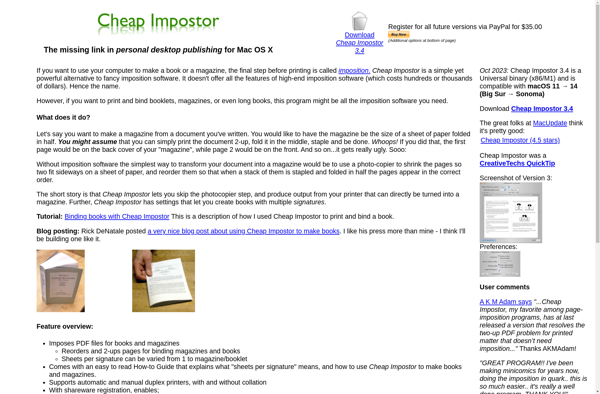
Cheap Impostor
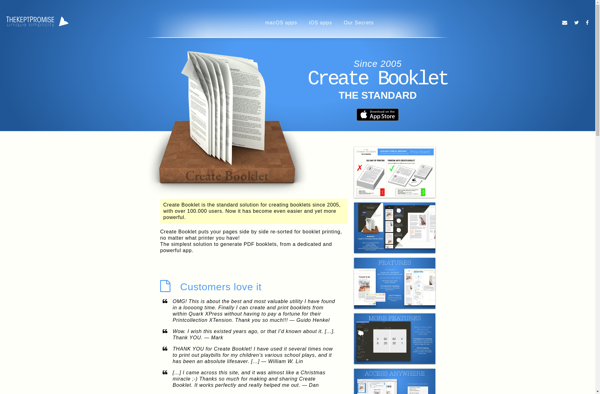
Create Booklet
Cocoabooklet
