IdealSqlTracer
IdealSqlTracer: Database Query Profiling and Analysis Tool
IdealSqlTracer is a database query profiling and analysis tool for MySQL, MariaDB, PostgreSQL, Oracle, SQL Server and DB2. It helps debug database performance issues by capturing all SQL activity and generating detailed query profiling reports.
What is IdealSqlTracer?
IdealSqlTracer is a comprehensive database query profiling and analysis tool for MySQL, MariaDB, PostgreSQL, Oracle, SQL Server and DB2 databases. It captures all SQL statements executed against the database along with execution details like timing, rows affected, temporary disk usage etc.
Key features include:
- No changes required to database server or application code for setup
- Profiles all SQL activity including that from orm frameworks
- Provides interactive visual analysis of most time consuming queries
- Identifies slow running SQL across large query loads
- Uncovers expensive queries that run infrequently
- Auto correlates SQL text with execution details
- Integrated explain plan analysis for problem queries
- Exports reports to help share performance data
IdealSqlTracer simplifies SQL optimization by eliminating the need to reproduce issues and providing all required context in one place. With minimal overhead, it can be run continuously on production systems to baseline performance and uncover hidden issues that stress tests may miss.
IdealSqlTracer Features
Features
- Captures all SQL activity and generates detailed query profiling reports
- Supports multiple database engines including MySQL, MariaDB, PostgreSQL, Oracle, SQL Server, and DB2
- Provides real-time monitoring and historical analysis of database queries
- Identifies slow-running queries, resource-intensive queries, and other performance bottlenecks
- Offers query optimization recommendations and SQL tuning suggestions
- Integrates with various development tools and IDEs
- Provides detailed execution plans and statistics for each query
Pricing
- Freemium
- Subscription-Based
Pros
Cons
Reviews & Ratings
Login to ReviewThe Best IdealSqlTracer Alternatives
View all IdealSqlTracer alternatives with detailed comparison →
Top Development and Database Tools and other similar apps like IdealSqlTracer
Here are some alternatives to IdealSqlTracer:
Suggest an alternative ❐Sql Server Profiler
DbForge Event Profiler for SQL Server

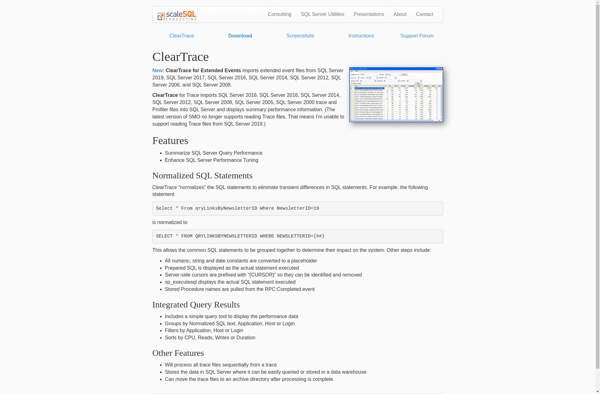
ClearTrace