Sql Server Profiler is a tool from Microsoft that captures detailed information about SQL Server database activity including events, performance data, and deadlocks. It helps developers and DBAs monitor, troubleshoot, and tune databases.
Sql Server Profiler: Detailed Database Activity Monitoring
Sql Server Profiler is a tool from Microsoft that captures detailed information about SQL Server database activity including events, performance data, and deadlocks. It helps developers and DBAs monitor, troubleshoot, and tune databases.
What is Sql Server Profiler?
Sql Server Profiler is a database profiling tool included with Microsoft SQL Server for recording server activity. With Profiler, database administrators and developers can capture and analyze a variety of information about SQL Server performance and activity including:
Stored procedure and query execution times
Triggers firing
Deadlocks occurring
Login attempts
Server resource usage metrics
And more...
By tracing events like these, Profiler gives insight into overall SQL Server health, aids in performance troubleshooting, and assists with tuning database issues. Key capabilities include:
Capturing activity from a live SQL Server instance or replaying trace files
Filtering traces to focus on specific events, databases, users, etc.
Analyzing trace data to identify slow queries, unused indexes, and other bottlenecks
Correlating client application behavior with database activity
Auditing security events like failed logins
Pinpointing deadlocked transactions
Profiler ships standard with SQL Server and provides a GUI for managing traces. Experienced DBAs rely on Profiler for monitoring production systems and developers use it for debugging queries during application development.
Sql Server Profiler Features
Features
Capture and analyze SQL Server database activity
Monitor events, performance data, and deadlocks
Troubleshoot and tune databases
Replay captured traces for further analysis
Customize trace templates and filters
Export trace data to various formats
Pricing
Free
Pros
Provides detailed insights into SQL Server performance
Helps identify and resolve performance issues
Supports a wide range of SQL Server versions
Integrates well with other Microsoft SQL Server tools
Offers a user-friendly interface
Cons
Limited to SQL Server databases only
May impact database performance during live tracing
Can generate large amounts of data, requiring careful management
Deprecated in favor of the newer SQL Server Management Studio (SSMS) tools
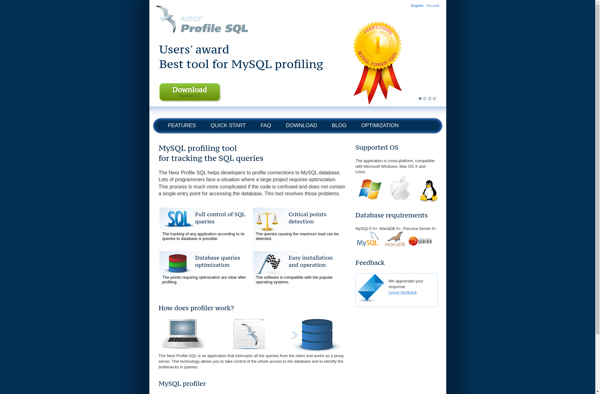
Neor Profile SQL is a high performance relational database management system optimized for online transaction processing (OLTP) workloads. It builds on top of the Neor virtualized architecture to deliver automatic scaling, high availability, and self-tuning capabilities.Key features include:Horizontal scaling - Automatically scales database resources by adding more nodes to meet...
ExpressProfiler is an open source performance profiling and debugging tool designed specifically for Node.js applications built with the Express web application framework. It allows developers to easily profile their Express apps to pinpoint performance bottlenecks and optimize application speed.Key features of ExpressProfiler include:Identifies slow endpoints and middleware in Express appsFlamegraph...
dbForge Event Profiler for SQL Server is a database auditing and profiling tool that captures SQL Server events and data changes in order to help developers and DBAs identify, debug, and resolve performance bottlenecks and database issues.It captures various events such as RPC batches, transactions, errors, deadlocks and more. The...
IdealSqlTracer is a comprehensive database query profiling and analysis tool for MySQL, MariaDB, PostgreSQL, Oracle, SQL Server and DB2 databases. It captures all SQL statements executed against the database along with execution details like timing, rows affected, temporary disk usage etc. Key features include:No changes required to database server or...
Datawizard SQL Profiler is a comprehensive database profiling and analysis solution for SQL Server. It captures detailed runtime statistics on all SQL activity including stored procedures, triggers, transactions, deadlocks and more. The advanced analysis features provide deep visibility into database performance, scalability and stability issues.Key features include:Lightweight data collection with...
ClearTrace is an open-source alternative to New Relic APM. It is used for monitoring and optimizing the performance of web applications, servers, and services in real-time. Some key features of ClearTrace include:Application performance monitoring - Track response times, error rates, Apdex score, and other key web application performance metrics.Transaction tracing...