Datawizard SQL Profiler
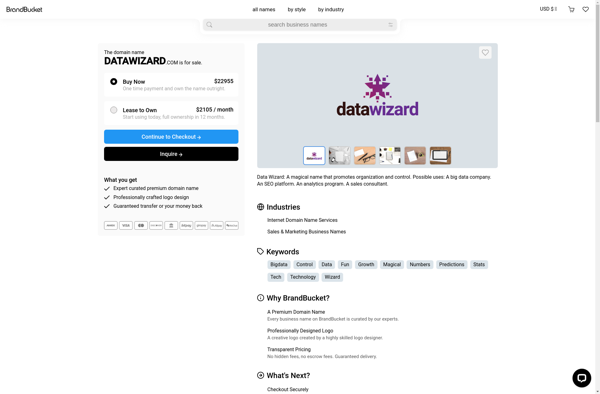
Datawizard SQL Profiler | Advanced Database Performance Analysis Tool
Datawizard SQL Profiler is a database profiling and analysis tool for SQL Server. It captures detailed statistics on SQL activity and helps identify performance bottlenecks.
What is Datawizard SQL Profiler?
Datawizard SQL Profiler is a comprehensive database profiling and analysis solution for SQL Server. It captures detailed runtime statistics on all SQL activity including stored procedures, triggers, transactions, deadlocks and more. The advanced analysis features provide deep visibility into database performance, scalability and stability issues.
Key features include:
- Lightweight data collection with configurable sampling rates to limit overhead
- Graphical and tabular analysis of SQL statement execution, duration, reads/writes, locks, blocks etc.
- Wait time and wait type analysis to identify bottlenecks
- Historical trend analysis to spot performance regressions
- Side-by-side comparison of profiler runs
- Deadlock detection and replay
- Integration with Performance Monitor for system-level analysis
- Query plan extraction and recommendations
- Filtering, search and bookmarking of SQL activity
- Summary dashboards and custom reporting
Datawizard SQL Profiler enables DBAs, developers and support engineers to quickly troubleshoot SQL server performance issues down to the query level. Its rich analytical features provide actionable insights for tuning and optimizing database code and configuration.
Datawizard SQL Profiler Features
Features
- Real-time SQL activity monitoring
- Detailed performance metrics and statistics
- Identification of performance bottlenecks
- Query analysis and optimization recommendations
- Historical data collection and reporting
- Customizable dashboards and alerts
Pricing
- Subscription-Based
Pros
Cons
Official Links
Reviews & Ratings
Login to ReviewThe Best Datawizard SQL Profiler Alternatives
View all Datawizard SQL Profiler alternatives with detailed comparison →
Top Development and Database and other similar apps like Datawizard SQL Profiler
Sql Server Profiler
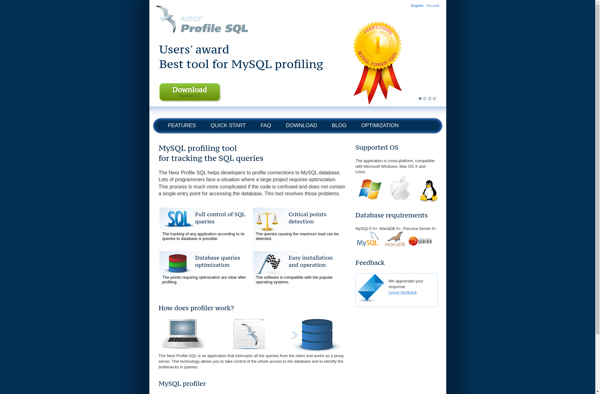
Neor Profile SQL
ExpressProfiler
DbForge Event Profiler for SQL Server

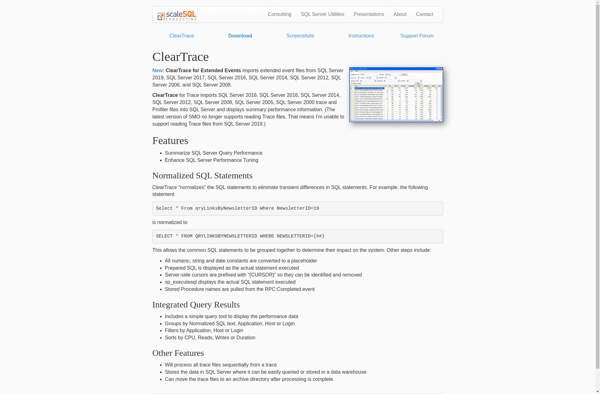
ClearTrace