Monitorix is an open source system monitoring tool. It provides monitoring of system resources such as memory, CPU load, disk space, network bandwidth, and more via a web interface. It features resource graphs and alerts to help analyze system performance.
An open source monitoring tool providing real-time monitoring of system resources, including memory, CPU load, disk space, and network bandwidth via a web interface.
What is Monitorix?
Monitorix is an open source system monitoring and visualization tool designed to monitor system resources and services on Linux/UNIX servers. It provides monitoring of key system metrics including CPU load, memory usage, disk space, network bandwidth utilization, and more. Monitorix features a built-in HTTP server to serve resource graphs and metrics through a web interface.
Some key features of Monitorix include:
Monitoring of system resources such as CPU load, memory, disk space, network bandwidth, etc.
Visualization of resource metrics through graphs and charts accessible through a web browser
Configuration via Perl scripts for customization and flexibility
Alerting and notification capabilities when configured thresholds are reached
Support for monitoring multiple servers from a central Monitorix installation
Minimal dependencies and lightweight footprint making it easy to deploy
Monitorix is implemented in Perl and RRDtool for data storage and graphing. It is highly customizable and extensible through plugins. It can monitor both local and remote Linux/UNIX servers. The resource graphs provide historical trends for analyzing system performance. Overall, Monitorix is a great open source system monitoring tool for visualizing key server metrics.
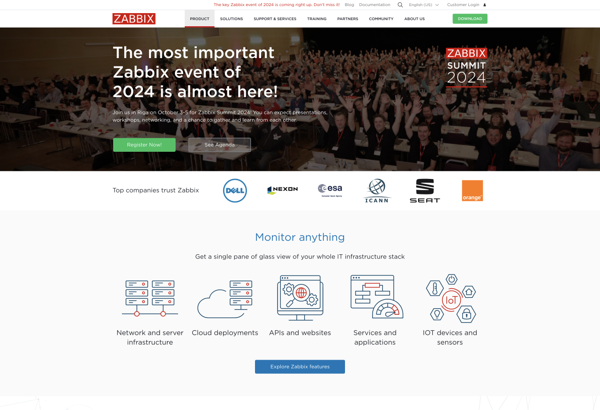
Zabbix is an enterprise-class open source distributed monitoring solution for networks and applications. It is designed to monitor and track the status of various network services, servers, and other network hardware. It provides real-time graphing, alerting, visualization and reporting for monitoring IT infrastructure performance and availability.Some of the key features...
Nagios is an open source computer system and network monitoring software application. It watches hosts and services, sends notifications when things go wrong, and alerts users when issues come up. Nagios helps system administrators detect and resolve IT infrastructure problems before they affect critical business processes.Some key capabilities of Nagios...
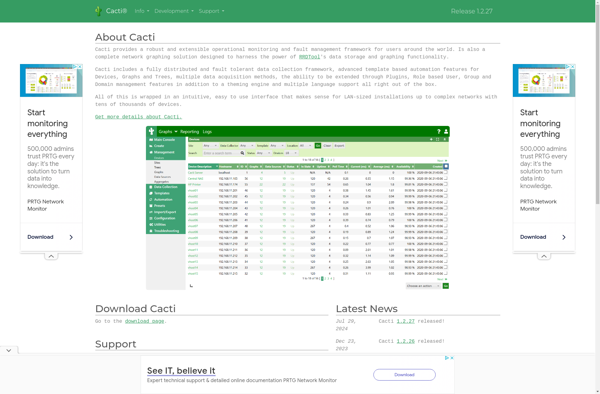
Cacti is a complete network graphing solution designed to harness the power of RRDTool's data storage and graphing functionality. Cacti provides a fast poller, advanced graph templating, multiple data acquisition methods, and user management features out of the box. All of this is wrapped in an intuitive, easy to use...
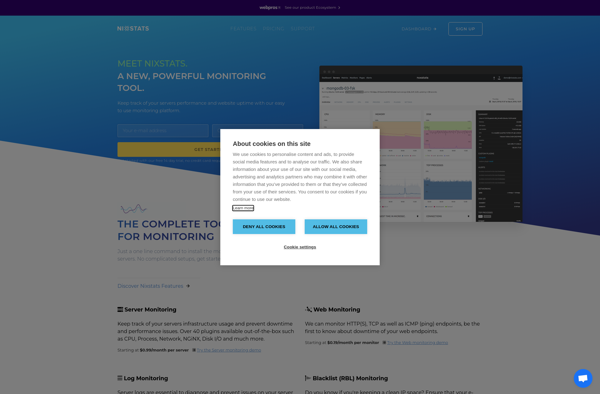
NIXStats is an open-source web analytics application that allows website owners to track and analyze traffic to their sites. It provides detailed statistics on visits, unique visitors, page views, bounce rates, traffic sources, and more. As an open-source platform, NIXStats places no restrictions on data collection or analysis and avoids...
Munin is a free and open source resource monitoring software designed to monitor computer systems and networks. It tracks resource usage, performance, and trends over time and generates graphical representations of the collected data.Some key features of Munin include:Monitoring of system resources like CPU usage, disk usage, memory, network bandwidth,...
Trafikito is a comprehensive digital marketing suite designed to help website owners, marketers, and agencies better understand and improve the traffic to their sites. Some key features of Trafikito include:Website traffic analytics - In-depth reporting on visits, Unique visitors, page views, bounce rates, conversion rates, and more. Integrates with Google...
SolarWinds Network Performance Monitor is a comprehensive network monitoring software designed to help IT professionals detect, diagnose, and resolve network performance issues. It provides a centralized view to monitor the health and performance of network devices across complex on-premise, hybrid, and cloud environments.Key features include:Automated network mapping and topology visualization...
A Linux temperature web monitor is a software application designed to display temperature sensor data from a Linux computer through a web browser interface. It works by collecting readings from hardware temperature probes and sensors inside the Linux system, including the CPU, GPU, motherboard and hard drives.The temperature readings are...
Server Density is a robust server and infrastructure monitoring platform designed to give development and IT operations teams deep visibility into system and application performance. Key features include:Intuitive dashboards for visualizing system health metrics like CPU usage, memory usage, disk space, and moreFlexible alerting capabilities to get notified of potential...