Visual DuxDebugger is a visual debugger and profiling tool for Unity games. It allows developers to visualize and analyze scenes, game objects, components, variables, methods and memory in real-time to optimize performance and fix bugs.
Visual DuxDebugger: Visual Debugger and Profiling Tool for Unity Games
Visual DuxDebugger is a visual debugger and profiling tool for Unity games. It allows developers to visualize and analyze scenes, game objects, components, variables, methods and memory in real-time to optimize performance and fix bugs.
What is Visual DuxDebugger?
Visual DuxDebugger is a powerful visual debugging and profiling toolkit designed specifically for Unity game development. It provides a range of tools to inspect, analyze and optimize Unity projects and content in real-time.
Key features include:
In-game debugging - Pause gameplay and step through code line-by-line to identify bugs.
Memory profiling - Detect memory leaks and inefficient allocations to optimize memory usage.
CPU/GPU profiling - Profile applications to pinpoint performance bottlenecks.
Custom debugging views - Visualize scene hierarchies, game object data, script variables/fields, Unity events, methods, textures, physics, debug logs and more during runtime to understand behaviors and interactions.
Memory snapshot comparison - Identify memory growth over time by comparing memory snapshots.
Platform support - Compatible with PC/Mac, iOS, Android, WebGL, Windows Store Apps, etc.
Editor integration - Easy to use debugging tools integrated seamlessly into the Unity Editor.
With its comprehensive visual debugging capabilities, Visual DuxDebugger is invaluable for Unity developers to optimize, analyze, test and understand their games during development.
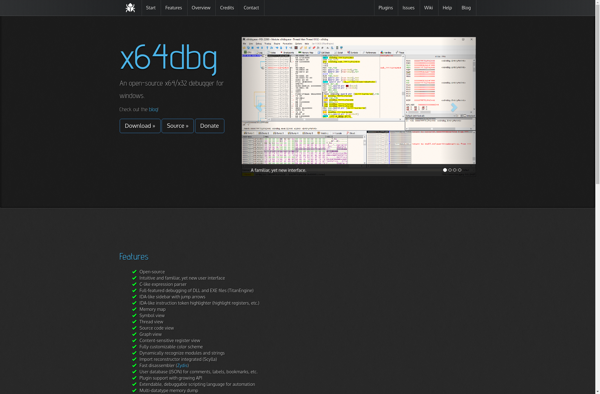
x64dbg is an advanced open-source x64/x32 debugger for Windows. It is designed for software developers to aid in reverse engineering and analyzing Windows binaries and programs. Some key features of x64dbg include:GPU decoding and tracing to debug modern graphics APIs like DirectX and OpenGLConditional, logging, memory and hardware breakpointsDisassembly view...
Immunity Debugger is a popular Windows debugger focused on analyzing malware. It has an intuitive graphical user interface to help visualize program execution flows and offers advanced debugging capabilities useful for reverse engineering.Key features of Immunity Debugger include:Ability to debug malicious software safely in a controlled environmentConditional breakpoints based on...
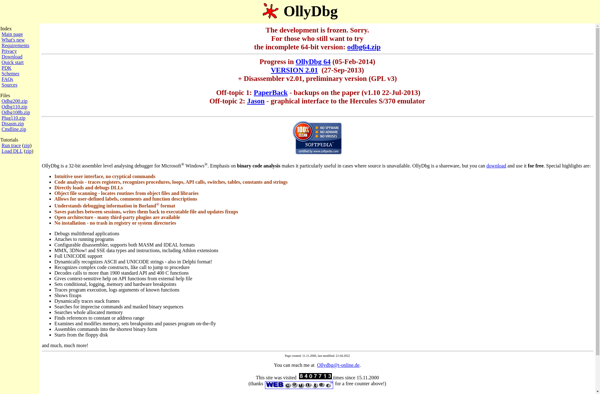
OllyDbg is a 32-bit assembler level analyzing debugger for Microsoft Windows. It is a very popular tool among reverse engineers and malware analysts due to its versatility and wide range of features useful for analyzing executable files.Some key features of OllyDbg include:Disassembler - allows disassembling code from executable files and...
WinDbg is a low-level debugger for Microsoft Windows systems and is one of the primary tools used for analyzing crashes, hangs, and other issues in Windows software. It is included in the Windows Driver Kit and part of the Windows SDK.Some key features and capabilities of WinDbg include:In-depth inspection of...
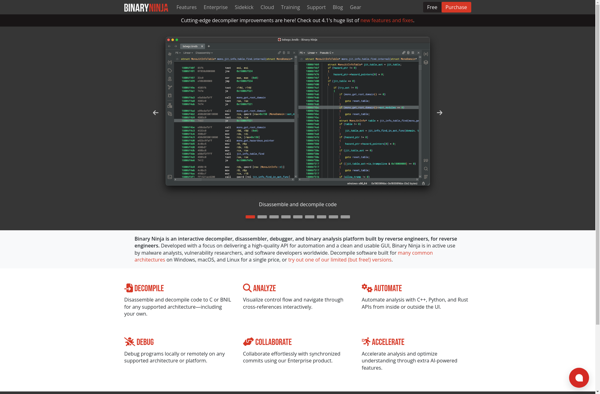
Binary Ninja is a versatile reverse engineering platform used for software analysis, vulnerability research, and reverse code engineering. It provides disassembly, decompilation, graphing, scripting, and other functionality to examine and modify binary programs.Some key features of Binary Ninja include:Supports a wide range of architectures including x86, ARM, MIPS, PowerPC, and...
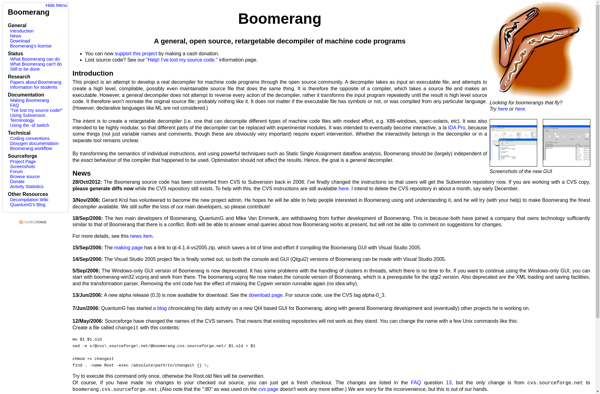
Boomerang decompiler is an advanced, open source decompiler for compiled programs. It can take an executable file generated by a compiler and attempt to transform it back into the original source code that built it.Boomerang supports decompilation of programs written in C, C++, Objective-C, and Java programming languages. It utilizes...
PEBrowseDbg64 Interactive is a powerful user mode debugger for 32-bit and 64-bit Windows applications. It features an intuitive graphical user interface that allows you to interactively debug your code by setting breakpoints, stepping through code, examining variables and memory, etc.Some key features of PEBrowseDbg64 Interactive include:Supports debugging 32-bit and 64-bit...