PEBrowseDbg64 Interactive is a user mode debugger for Windows that allows interactive debugging of 32-bit and 64-bit applications. It features a graphical user interface and integrates with Visual Studio.
User mode debugger for Windows allowing interactive debugging of 32-bit & 64-bit applications, featuring a graphical UI and integration with Visual Studio.
What is PEBrowseDbg64 Interactive?
PEBrowseDbg64 Interactive is a powerful user mode debugger for 32-bit and 64-bit Windows applications. It features an intuitive graphical user interface that allows you to interactively debug your code by setting breakpoints, stepping through code, examining variables and memory, etc.
Some key features of PEBrowseDbg64 Interactive include:
Supports debugging 32-bit and 64-bit Windows applications
Integrates seamlessly with Visual Studio
Graphical user interface for interactive debugging sessions
Ability to set code breakpoints
Step through code line-by-line
Inspect variables, registers, memory and other runtime information
Multiple debugging windows for call stack, threads, modules, memory dumps and more
Scriptable via Python for advanced programmatic control
PEBrowseDbg64 Interactive is an excellent choice for developers who want a robust and full-featured user mode debugger for debugging Windows applications. Its integration with Visual Studio makes it easy to use alongside existing development workflows.
PEBrowseDbg64 Interactive Features
Features
Graphical user interface for debugging
Support for 32-bit and 64-bit Windows applications
Integration with Visual Studio
Memory viewing and editing
Breakpoints
Step debugging
Call stack
Disassembly
Registers
Threads
Modules
Processes
Pricing
Free
Pros
Easy to use GUI
Good integration with Visual Studio
Supports both 32-bit and 64-bit debugging
Full featured debugger
Cons
Not open source
Limited to Windows platform
Less features than commercial debuggers like WinDbg
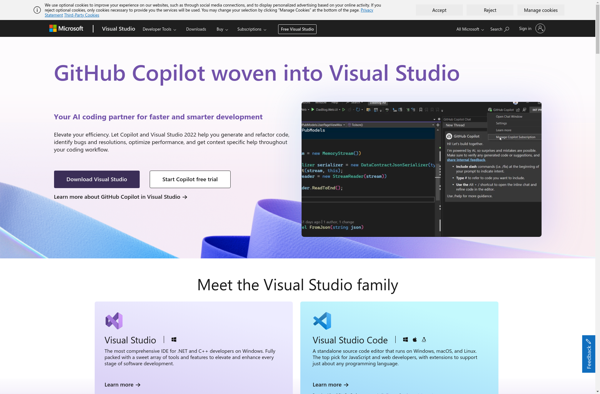
Microsoft Visual Studio is a fully-featured integrated development environment (IDE) for creating applications on the Windows platform as well as web and cloud platforms. First released in 1997, Visual Studio has become one of the most popular and widely-used IDEs for software development.Visual Studio supports a wide range of programming...
Immunity Debugger is a popular Windows debugger focused on analyzing malware. It has an intuitive graphical user interface to help visualize program execution flows and offers advanced debugging capabilities useful for reverse engineering.Key features of Immunity Debugger include:Ability to debug malicious software safely in a controlled environmentConditional breakpoints based on...
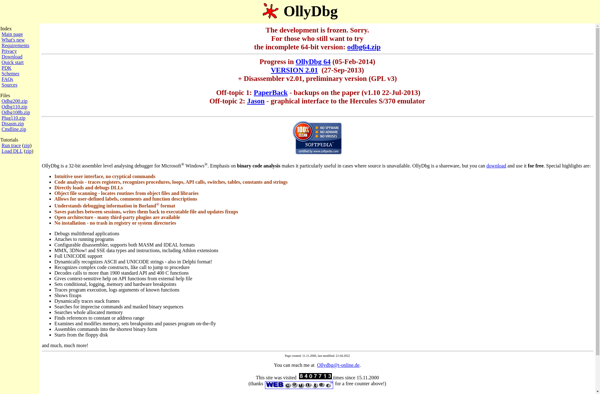
OllyDbg is a 32-bit assembler level analyzing debugger for Microsoft Windows. It is a very popular tool among reverse engineers and malware analysts due to its versatility and wide range of features useful for analyzing executable files.Some key features of OllyDbg include:Disassembler - allows disassembling code from executable files and...
WinDbg is a low-level debugger for Microsoft Windows systems and is one of the primary tools used for analyzing crashes, hangs, and other issues in Windows software. It is included in the Windows Driver Kit and part of the Windows SDK.Some key features and capabilities of WinDbg include:In-depth inspection of...
ODA Online Disassembler (ODA) is a free online disassembly tool that runs fully in your web browser without requiring any downloads or installations. It allows you to easily disassemble executable files such as EXE, DLL, OCX, CPL, SYS, OBJ, LIB, etc. for a variety of processor architectures including x86, amd64,...
Cevelop is an open-source integrated development environment (IDE) designed specifically for C and C++ development. It is based on the popular Eclipse platform and offers advanced code assistance, analysis, debugging, testing, and profiling tools to improve developer productivity.Some key features of Cevelop include:Intelligent code completion and syntax highlightingCall graph visualization...
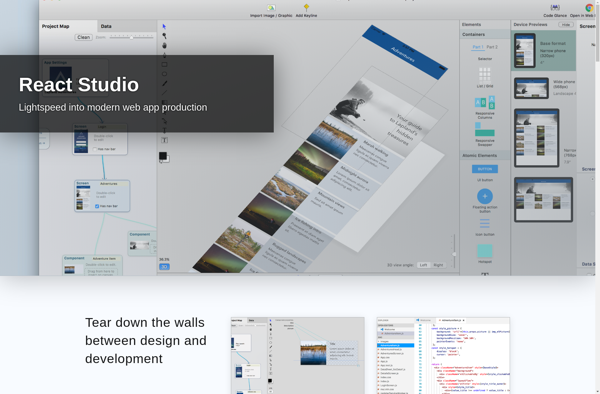
React Studio is a low-code platform that allows you to visually build web and mobile applications using React, without writing any code. It provides a drag-and-drop interface where you can add components like tables, charts, forms, etc. and connect them to create full-stack React apps.Some key features of React Studio:Visual...
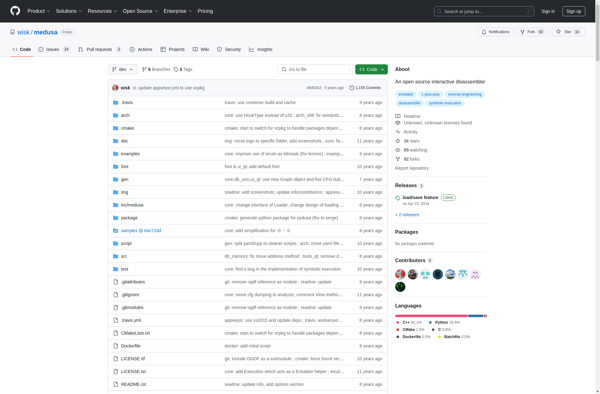
Medusa is an open-source, cross-platform interactive disassembler aimed at malware analysis and reverse engineering. It features a graphical user interface for easy navigation and analysis of disassembled code.Some key capabilities and features of Medusa include:Intuitive graphical user interface for navigating and inspecting disassembled codeIntegration with debuggers like GDB, WinDBG, and...
ArkDasm is a feature-rich graphical disassembler and debugger that allows analyzing and reverse engineering executable files for Windows, Linux, and MacOS operating systems. It can disassemble object code, bytecode, shared libraries, dynamic link libraries, and more to transform machine-readable code into human-readable assembly language.With an intuitive user interface, ArkDasm makes...
Visual DuxDebugger is a powerful visual debugging and profiling toolkit designed specifically for Unity game development. It provides a range of tools to inspect, analyze and optimize Unity projects and content in real-time.Key features include:In-game debugging - Pause gameplay and step through code line-by-line to identify bugs.Memory profiling - Detect...