Visualisator 5000 is a data visualization software that allows users to easily create interactive charts, graphs, and dashboards from their data. It has a user-friendly drag-and-drop interface to build custom visualizations quickly without coding.
Visualisator 5000: Data Visualization Software for Interactive Charts & Dashboards
Visualisator 5000 enables users to create custom interactive charts, graphs, and dashboards from their data with its user-friendly drag-and-drop interface and coding-free experience.
What is Visualisator 5000?
Visualisator 5000 is a powerful yet easy-to-use data visualization and dashboarding software solution for businesses. With its intuitive drag-and-drop interface, Visualisator 5000 makes it simple for anyone to connect to data sources, build interactive dashboards and share insights with colleagues or customers.
Some key features and benefits of Visualisator 5000 include:
Flexible, customizable dashboards - Choose from a variety of chart types like bar, line, pie, scatter plots etc. and set up dashboards with filters, parameters and other controls to create interactive views of your data.
Collaboration tools - Annotate, comment on dashboards and visualize data together with teammates. Manage user access controls.
Variety of data connectivity options - Connect to SQL & NoSQL databases, cloud apps like Google Analytics, Flat files like CSV etc. Real-time and in-app data modeling supported.
Pixel perfect reporting - Create, schedule and share polished reports in various formats like PDF, PPT etc. Pixel perfect control over report design and layouts.
Options for embedding and sharing - Embed dashboards and reports into internal portals or your public website or app. Control access as needed.
With its easy learning curve, customizable visualizations and versatile sharing capabilities, Visualisator 5000 is the ideal data visualization and business intelligence platform for agile, data-driven organizations and teams.
Visualisator 5000 Features
Features
Drag-and-drop interface for building custom visualizations
Interactive charts, graphs, and dashboards
Connects to various data sources
Customizable color schemes and formatting options
Collaborative features for sharing and presenting visualizations
Automatic data updates and real-time visualization
Pricing
Freemium
Subscription-Based
Pros
User-friendly and intuitive interface
Ability to create complex visualizations without coding
Wide range of visualization types and customization options
Supports integration with popular data sources
Collaborative features for sharing and presenting data
Cons
Limited free version with restricted features
Subscription-based pricing model can be expensive for some users
Potential performance issues with large datasets
Limited advanced analytical capabilities compared to specialized BI tools
Winamp is a highly customizable media player for Windows that has been popular since its initial release in 1997. It supports playback of a wide range of audio and video formats including MP3, AAC, WMA, FLAC, Ogg Vorbis, WAV, MIDI, and many more.Some key features of Winamp include:Customizable interface with...
Avee Player is a free video player and editor for Windows that makes it easy for anyone to create visually impressive videos. With Avee Player's drag-and-drop interface, users can take video clips, photos, audio files and apply special effects, transitions, texts, stickers and motion graphics with just a few clicks.Key...
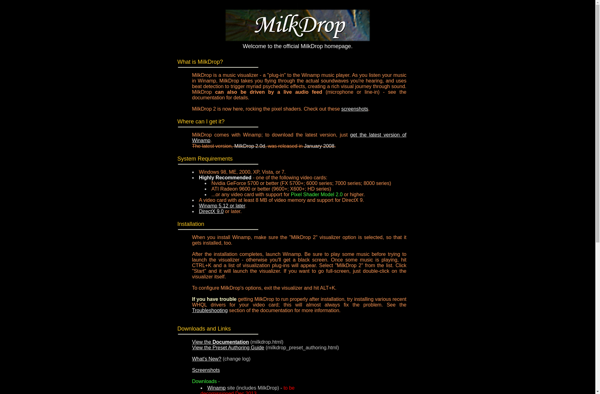
MilkDrop is an audio visualizer plugin for the Winamp media player developed by Ryan Geiss. It displays animated visuals that react and move with the music being played in Winamp, allowing users to create their own unique visual listening experience.Some key features of MilkDrop include:A large library of pre-made visualizations...
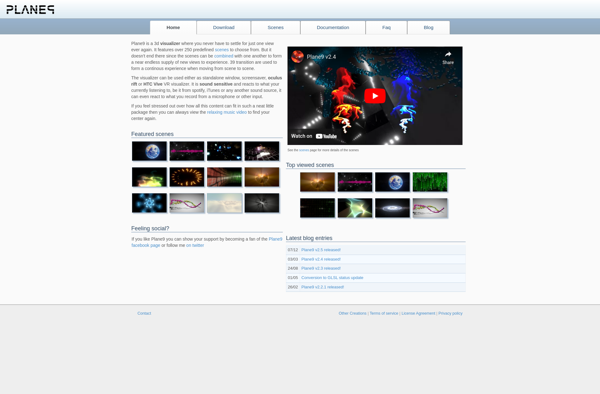
Plane9 is an open source, real-time 3D visualizer program designed to be used as both a music visualizer and video screensaver. It works by taking audio input from the user's computer and displaying reactive, animated 3D graphics and visualizations that correspond to the music in real-time.Some key features of Plane9...
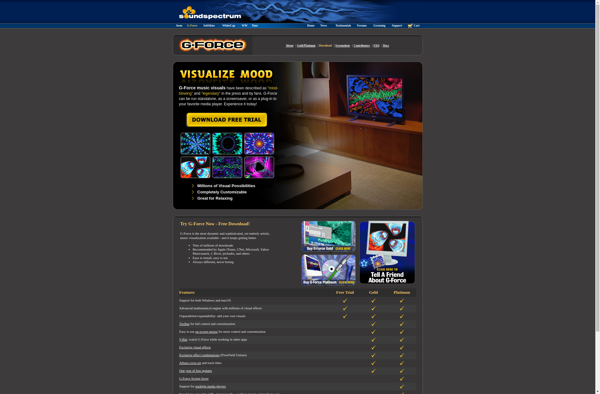
G-Force is a dynamic music visualizer software designed to create animated visuals that react and dance with the music playing from your computer's media player or live audio input. With its physics-based animation engine, G-Force generates visualizations that burst, bounce, and transform to the frequency peaks and rhythms of your...
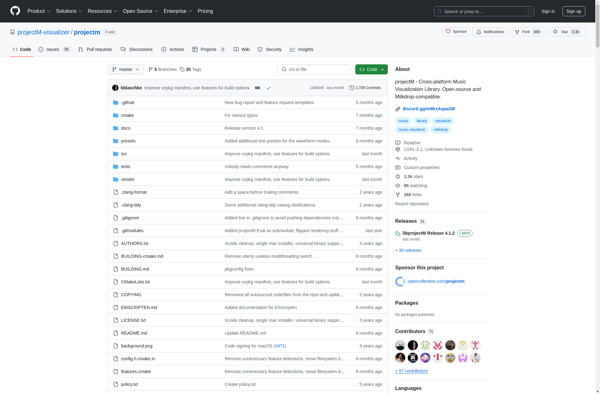
projectM is an advanced open-source music visualization software that runs on Windows, MacOS, and Linux. It connects to pulseaudio or OpenAL to retrieve audio input from the user's system in real-time and renders stunning interactive visualizations that react to the music.Some key features of projectM include:Per-pixel OpenGL fragment shaders and...
Kauna is an open-source, cross-platform audio visualizer software that generates animated graphics in real-time based on audio input from a microphone or any other audio source. It supports a wide range of visualization modes including oscilloscope, spectrum analyzer, waveform, point cloud, etc.Some of the key features of Kauna include:Supports various...
Free Visualizer Music is a free software that generates visualizations and animations that react to the music you're playing in real-time. It can be a great way to enhance your listening experience or create eye-catching videos and live performances.Some of the key features of Free Visualizer Music include:Customizable visualization templates...
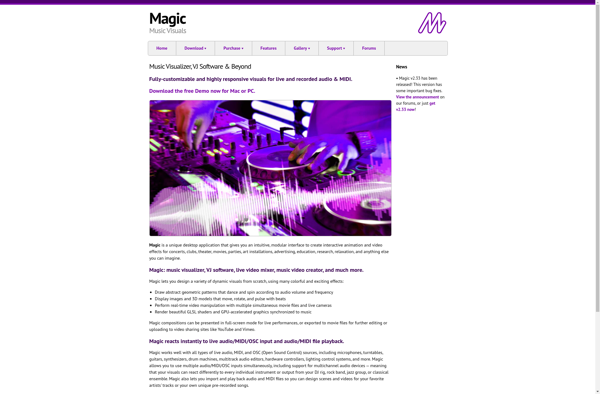
Magic Music Visuals is a visualizer software for Windows that creates animated visuals that react and sync to the music or audio being played. It offers a diverse range of visualization styles including abstract shapes, flames, particle effects, tunnels, ribbons, and more that pulse, change, and transform with the frequency,...
cli-visualizer is an open-source command line utility that helps visualize the textual output of other CLI tools and scripts. It captures the text output and automatically generates graphs, charts, and diagrams for the data to make it easier to analyze.Some key features of cli-visualizer include:Support for visualizing outputs from popular...
Cthugha is an open-source software library that provides GPU-accelerated video and image processing capabilities. It is designed to make it easy for developers to take advantage of the parallel processing power of modern GPUs for computer vision and video processing tasks.Some key features of Cthugha include:Hardware-accelerated video decoding and encoding...
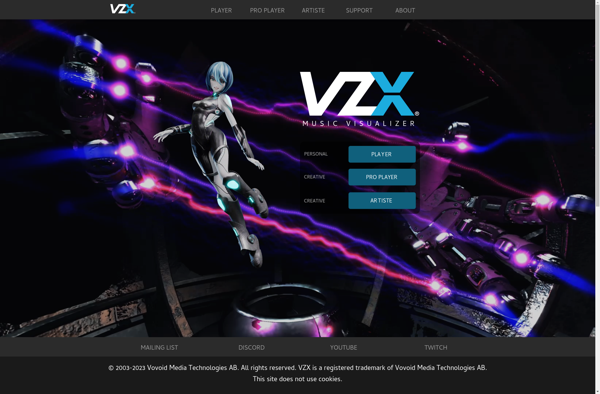
VZX Music Visualizer is a music visualization software for Windows that creates animated visualizations that react and dance along with music playing on your computer. It offers a high level of customizability, allowing you to tweak the visuals to your liking.Some of the key features of VZX Music Visualizer include:Generates...
DADIM is an open-source database design and modeling tool used for visualizing, designing, and prototyping relational databases. It provides an intuitive graphical interface that allows database architects and developers to:Visually design database models using entity relationship diagramsGenerate SQL code for creating databases from the designed modelsReverse engineer existing databases into...
Encore Music is a digital music library management software designed specifically for professional DJs, musicians, and music collectors. It provides powerful tools to organize, analyze, and access large music libraries.Key features of Encore Music include:Intuitive tagging system to add titles, artists, albums, genres, comments, and more metadata to audio filesSmart...
APEXvj is an open-source visualization and machine learning platform that was purpose-built for computer vision applications and video analysis. It has an easy-to-use graphical user interface that allows you to quickly build computer vision machine learning models without needing to code using a drag and drop workflow interface. It comes...