Visualyzer

Visualyzer: Data Visualization & Dashboard Creation Software
Connect to various data sources, transform and clean data, and create interactive dashboards and reports without coding with Visualyzer.
What is Visualyzer?
Visualyzer is a powerful business intelligence and data visualization software used to create interactive dashboards, reports, and analytics. It provides an easy-to-use drag and drop interface allowing users to connect to multiple data sources including SQL, NoSQL databases, cloud apps, flat files, etc.
With Visualyzer, users can ingest, combine, and transform data from these sources to prepare it for analysis. Its strong ETL capabilities include functions to filter, aggregate, sort, join, and more. Users can then build dashboards containing various charts and graphs like bar, pie, line, scatter plots, pivot tables, KPIs, gauges and maps.
These visualizations auto-update when underlying data changes in real-time. Users can also add advanced features like drill down, dynamic filtering, alerts, access controls and more without coding. Visualyzer also helps collaborate by allowing dashboard sharing with others or publishing online.
It comes with hundreds of out-of-the-box templates and themes to create pixel-perfect, boardroom-ready reports quickly. The self-service model and intuitive interface make it easy for non-technical users to prepare, analyze and visualize complex data.
Visualyzer Features
Features
- Drag-and-drop interface for building dashboards
- Connects to various data sources like SQL, MongoDB, REST APIs
- Has a library of customizable widgets like charts, grids, gauges
- Allows collaboration by sharing dashboards with other users
- Has scheduling and alerting capabilities
Pricing
- Freemium
- Subscription-Based
Pros
Cons
Official Links
Reviews & Ratings
Login to ReviewThe Best Visualyzer Alternatives
View all Visualyzer alternatives with detailed comparison →
Top Office & Productivity and Data Visualization and other similar apps like Visualyzer
Here are some alternatives to Visualyzer:
Suggest an alternative ❐Miro

Aha!

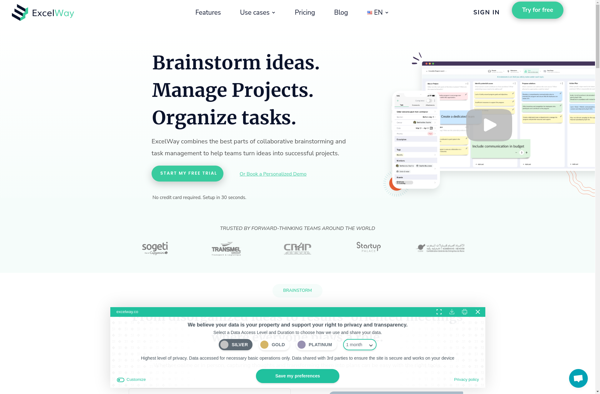
Excelway
IdeaBuddy

Strategyzer

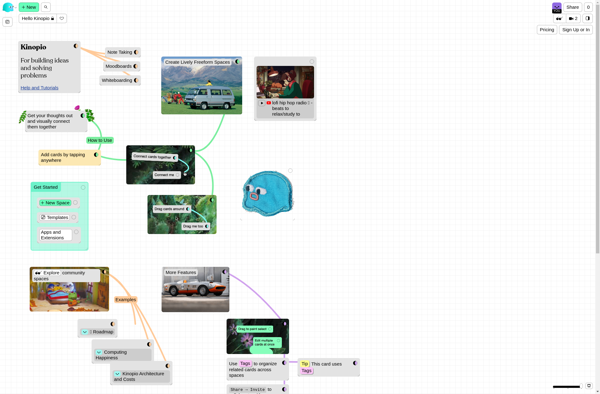
Kinopio
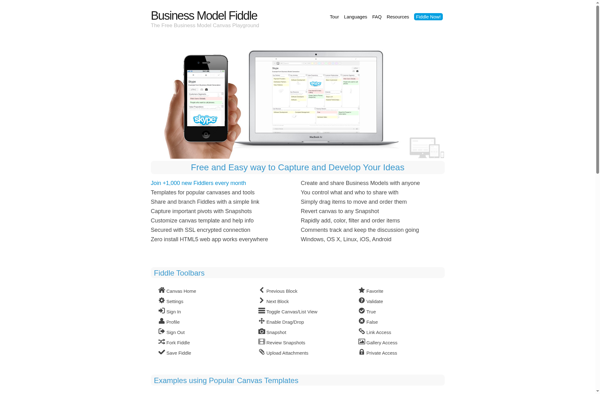
Business Model Fiddle
Abizmo

Creatlr
Vizologi

BussMo
Idea Drop