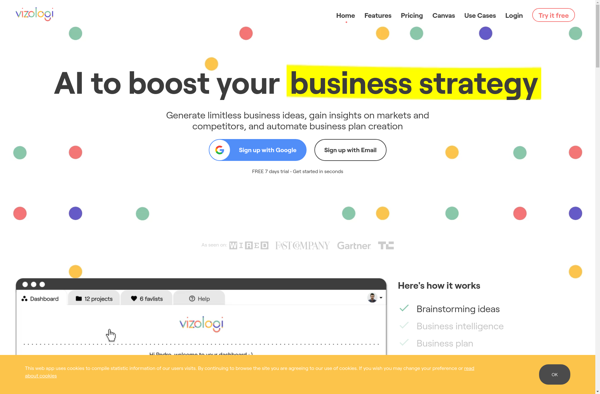
Vizologi is a data visualization and business intelligence software that allows users to connect to various data sources, create interactive dashboards and data stories, and share analytics through web and mobile apps. It's known for its user-friendly drag-and-drop interface
Vizologi: Data Visualization and Business Intelligence Software
Connect to various data sources, create interactive dashboards, share analytics through web and mobile apps, with a user-friendly drag-and-drop interface.
What is Vizologi?
Vizologi is a versatile business intelligence and data visualization platform designed to help companies gain meaningful insights from their data. Its intuitive drag-and-drop interface makes it easy for non-technical users to connect multiple data sources, create customized dashboards and reports, and share analytics through web and mobile applications.
Some key features of Vizologi include:
Flexible data connectors to integrate data from SQL & NoSQL databases, cloud apps, etc.
Customizable dashboards with advanced charts, tables, filters, and KPI widgets
Geospatial analysis and mapping capabilities
Data storytelling with interactive slideshows and narratives
Scheduled reports and distribution to share insights company-wide
Responsive mobile applications to access dashboards on-the-go
Collaboration tools like annotations, comments and version control on dashboards
Granular security settings and user access controls
Vizologi positions itself as an easy, self-service BI platform tailored to the needs of small to midsize businesses. With its user-friendly interface and broad feature set, it aims to make data more understandable and accessible to every employee regardless of technical proficiency.
Vizologi Features
Features
Drag-and-drop interface to create dashboards
Connect to data sources like SQL, MongoDB, REST APIs
Create charts, tables, filters, parameters
Build interactive dashboards with drilling, linking
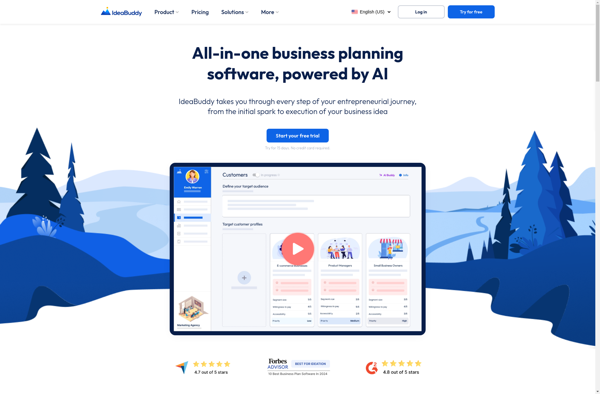
IdeaBuddy is a cloud-based creative ideation and brainstorming software designed to help teams generate breakthrough ideas and innovations. Its key features include:Idea generation boards - Interactive virtual whiteboards where teams can quickly brainstorm and organize ideas using virtual sticky notes.Mind mapping - Visualize connections between ideas to spark new ones...
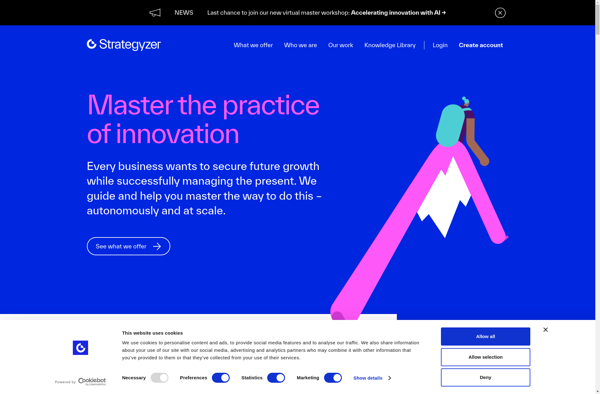
Strategyzer is a software platform designed for strategy planning and execution. It allows users to create visual strategy maps, value proposition canvases, business model canvases, and other strategic diagrams.With an intuitive drag-and-drop interface, teams can easily map out ideas, initiatives, and strategic plans on a virtual canvas. Key features include:Various...
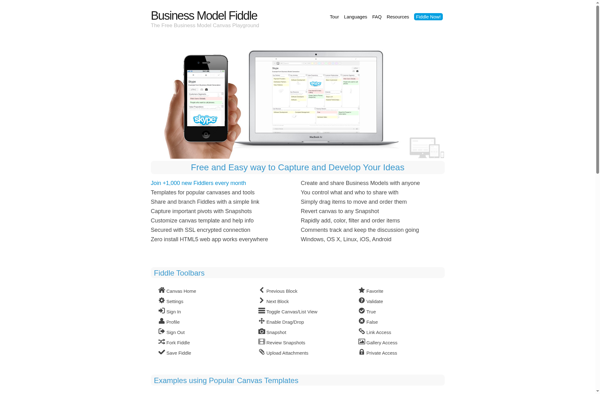
Business Model Fiddle is a free online tool for quickly sketching out and iterating on business model ideas and canvas templates. It is designed to help entrepreneurs, startups, and established companies conceptualize, analyze, and communicate their business models through interactive diagrams and components.Some key features of Business Model Fiddle include:Intuitive...
Abizmo is a comprehensive cloud-based business management platform aimed at small and mid-sized companies. It brings together features for project management, billing and invoicing, time and expense tracking, reporting and more into a single integrated solution.Key features of Abizmo include:Project management - plan projects, create tasks, assign to team members,...
Creatlr is a versatile graphic design and image editing software suitable for designers, photographers, illustrators and hobbyists. It provides a wide range of easy-to-use tools for creating and editing images, designs, illustrations and animations.Some of the key features of Creatlr include:Intuitive and customizable interfaceHundreds of professional design templatesAdvanced drawing and...
Visualyzer is a powerful business intelligence and data visualization software used to create interactive dashboards, reports, and analytics. It provides an easy-to-use drag and drop interface allowing users to connect to multiple data sources including SQL, NoSQL databases, cloud apps, flat files, etc.With Visualyzer, users can ingest, combine, and transform...
BussMo is an all-in-one business management software aimed at small and medium businesses. It integrates key functionalities like accounting, inventory management, sales, purchasing, workflow management, reporting, and analytics into a single platform.Some key features of BussMo include:Accounting - automated invoicing, expense tracking, bank reconciliation, financial reportingSales and CRM - pipeline...