Frappé Charts vs JavaScript InfoVis Toolkit
A side-by-side look at Frappé Charts and JavaScript InfoVis Toolkit. For an in-depth review of either product, follow the links below.

Frappé Charts
Office & Productivity
Frappé Charts is an open source charting and data visualization tool. It allows users to create interactive charts, graphs and maps to represent data visually. It is built on Python and JavaScript and has a simple and intuitive drag-and-drop interface.
chartsgraphsdata-visualizationdraganddroppythonjavascript
JavaScript InfoVis Toolkit
Development
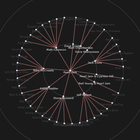
The JavaScript InfoVis Toolkit is an open-source JavaScript library for creating interactive data visualizations for the web. It provides tools for charts, graphs, diagrams, and other visual representations of complex data.
data-visualizationchartsgraphsdiagrams