Google Map Maker
Description: Google Map Maker was a crowdsourced mapping service that allowed users to edit and update Google Maps with local knowledge. It helped improve the accuracy and coverage of Google Maps by enabling public map edits and additions.
Type: software
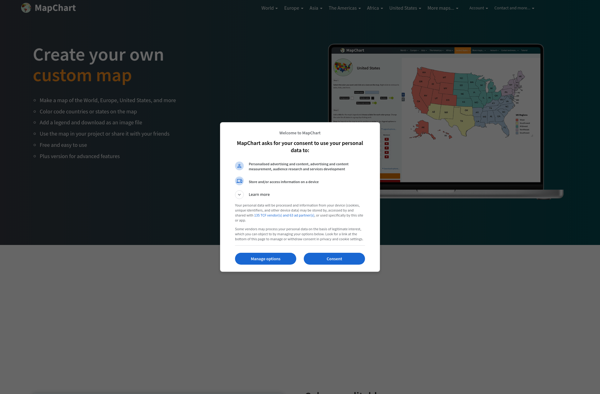
Map Chart
Description: Map Chart is a data visualization software that allows users to create customized maps to visualize data tied to geographic locations. It provides choropleth, bubble, and marker maps to represent values across countries, regions, states etc.
Type: software