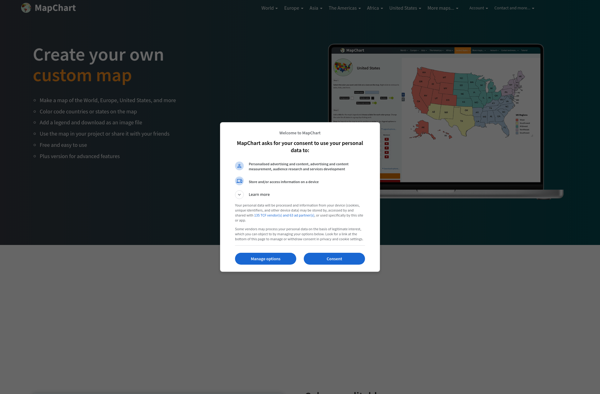
Map Chart is a data visualization software that allows users to create customized maps to visualize data tied to geographic locations. It provides choropleth, bubble, and marker maps to represent values across countries, regions, states etc.
Map Chart: Data Visualization Software for Customized Maps
Map Chart is a data visualization software that allows users to create customized maps to visualize data tied to geographic locations. It provides choropleth, bubble, and marker maps to represent values across countries, regions, states etc.
What is Map Chart?
Map Chart is a powerful yet easy-to-use data visualization software designed specifically for creating customized maps. It enables users to visualize various datasets tied to geographic locations on insightful choropleth, bubble and marker maps.
The software provides a drag-and-drop interface to map any data across countries, states, regions, postal codes and more using color coding and graduated shades. Users can represent metrics like population, economic indicators, survey responses and more on the maps.
Key features include:
Interactive choropleth maps with color gradients
Customizable bubble maps sized by values
Marker maps with pie charts and graphs
Support for CSV, Excel, JSON data sources
Tilesets for global and regional maps
Legend and scale configuration
Map exploration tools
Export images and PDF maps
Secure cloud hosting
With simple visual configuration options and powerful rendering and geocoding capability, Map Chart enables business analysts, researchers, surveyors and academics to create insightful map visualizations and dashboards for spatial representation of data.
Map Chart Features
Features
Create choropleth, bubble and marker maps
Customize map appearance with colors, labels, tooltips
Annotate maps with drawings and text
Import data from Excel, CSV files
Geocode data based on address/location
Export maps as image files or PDFs
Pricing
Subscription-Based
Pros
Intuitive drag-and-drop interface
Many customization options for maps
Good for visualizing geographic data trends
Integrates well with other Office apps
Cons
Steep learning curve for advanced features
Limited built-in geographic data
Not suitable for complex cartography tasks
Only available as part of Microsoft 365 subscription
Mapbox Studio is a powerful desktop application for designing custom map styles. It provides a graphical user interface that allows you to visually style vector tiles created with Mapbox tools and services.Some key features of Mapbox Studio include:Import vector tilesets created with Mapbox tools like Mapbox Streets and SatelliteStyle map...
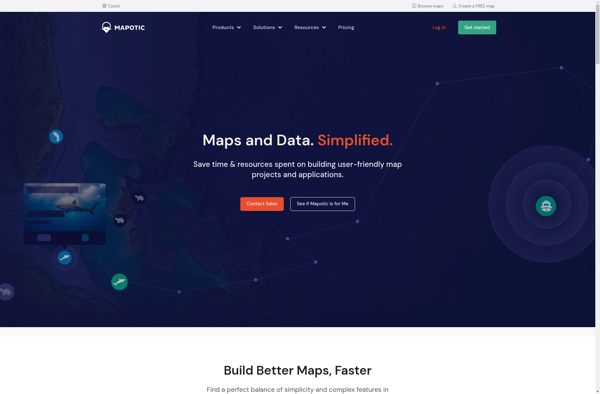
Mapotic is an open-source, self-hosted alternative to Mapbox that provides developers and designers with tools for creating interactive maps. Some key features of Mapotic include:Ability to design custom base maps with Mapnik and CartoCSSSupport for overlaying vector and raster map tiles from various sourcesTools for visualizing, analyzing, and processing geospatial...
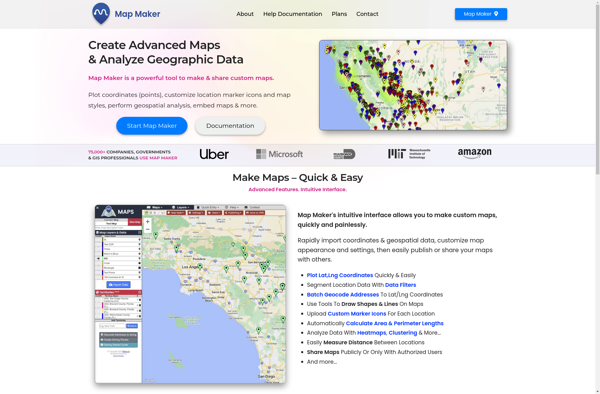
Map Maker by Google is a free, web-based tool that allows anyone to create custom Google Maps without needing expertise in geographic information systems (GIS). It has an intuitive drag-and-drop interface that makes it easy for users to add their own locations, landmarks, boundaries, lines, shapes, notes, and custom imagery...
Map3 is a versatile mind mapping and brainstorming software used to visually organize ideas, concepts, notes, and tasks. With Map3, users can create flexible and free-flowing maps to connect thoughts and information.Some key features and capabilities of Map3 include:Tree, org chart, flowchart map views to structure informationTagging and searching maps...
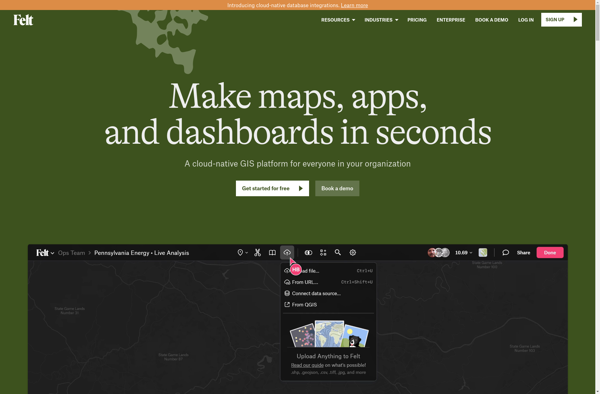
Felt is an open-source web-based application for kanban-style project management and task tracking. It provides a visual interface for organizing tasks into pipelines represented as boards, lists, and cards.Some key features of Felt include:Boards to organize projects and track progress across different stagesCustom lists within each board to categorize tasks...
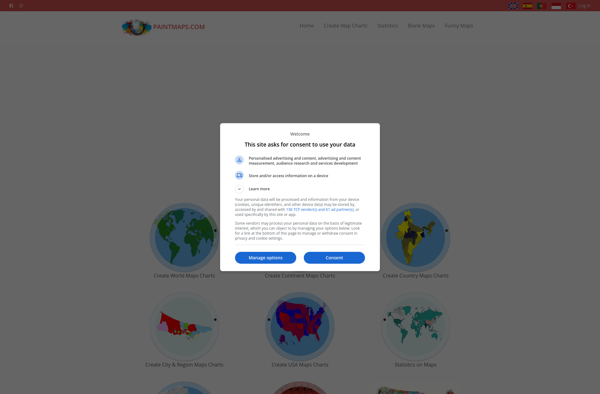
Paintmaps.com is a free online painting application that runs directly in your web browser. It allows users to create digital drawings and paintings using a range of brushes, colors, layers, and other tools.Some key features of Paintmaps.com include:Intuitive canvas interface for drawing and paintingVariety of brush types including pencils, pens,...
IndieMapper is an open source, offline-capable web map editor tailored for field mappers and humanitarians. It provides an intuitive and easy-to-use interface for collecting, editing, analyzing and exporting geographic data without an internet connection.Some key features of IndieMapper include:Works completely offline for areas with limited connectivityOpenStreetMap-based base maps with global...
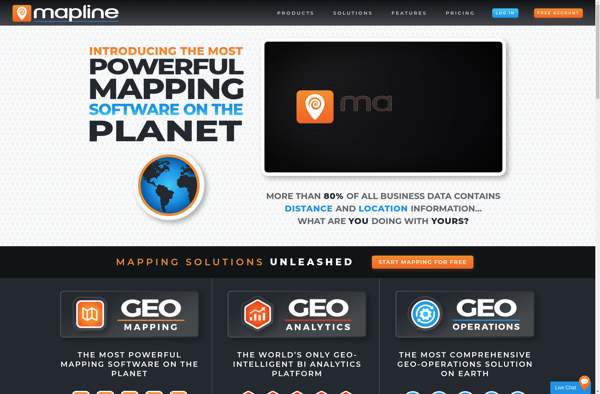
Mapline is an open-source, self-hosted web application that allows users to create custom maps for free. It is an alternative to proprietary services like Google My Maps.Some key features of Mapline include:Ability to add markers, lines, shapes, and text notes to your mapsSupport for multiple layers on a single mapOptions...
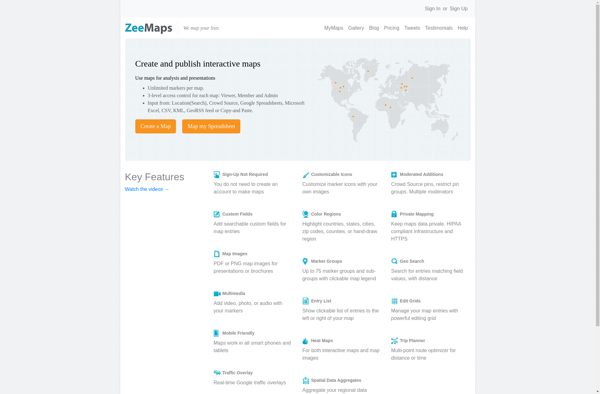
ZeeMaps is an easy-to-use online map creation and sharing application. It allows anyone to create great looking custom maps for free without GIS expertise or design skills.With ZeeMaps, you can add markers, lines, shapes, text notes, images, and videos to your maps to effectively visualize locations, routes, areas and associated...
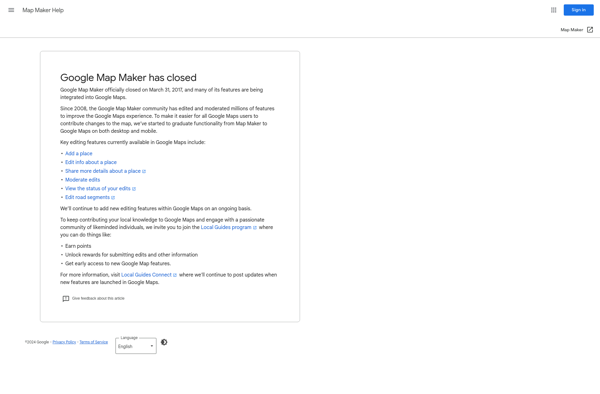
Google Map Maker was a crowdsourced mapping service launched by Google in 2008. It allowed volunteer mappers to edit and update Google Maps with local geographical information and knowledge. The goal of Map Maker was to harness contributions from the public to improve the accuracy, coverage, and freshness of Google...
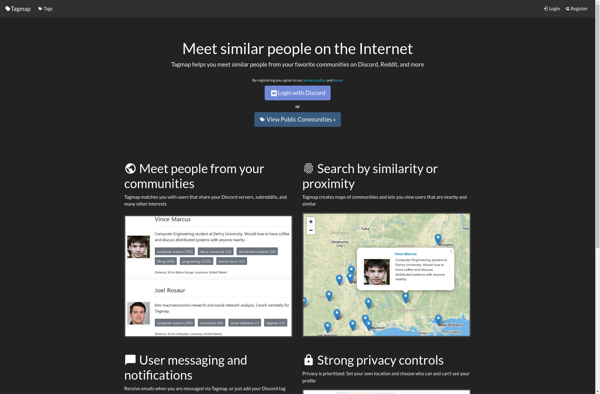
Tagmap is a versatile mind mapping and brainstorming software for organizing ideas and information visually. It enables users to create colorful, tag-based maps to capture thoughts, make associations, organize research, take notes, plan projects, and more.Key features include:Intuitive drag and drop interface for easily building mapsHundreds of professionally designed map...
Inkata is a free, open-source alternative to Microsoft Visio for creating diagrams and vector graphics. As an alternative, Inkata provides many of the key features of Visio at no cost.Like Visio, Inkata is designed specifically for diagramming and includes intuitive tools for creating flowcharts, UML diagrams, network maps, floor plans,...