Microsoft Power BI
Description: Microsoft Power BI is a business analytics service that enables users to visualize and analyze data, share insights across an organization, and make informed business decisions. It offers a suite of tools for data preparation, analysis, and visualization, facilitating interactive and compelling reports and dashboards.
Type: software
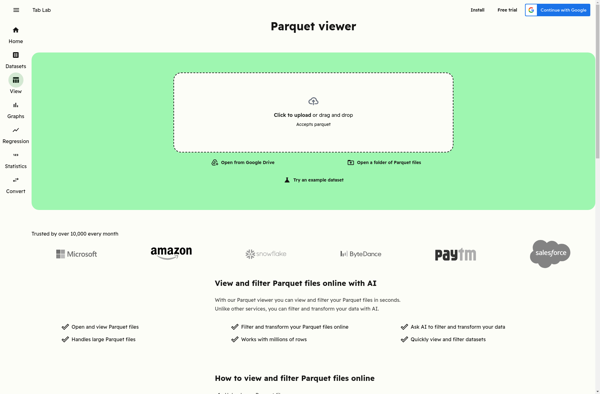
Parquet Data Viewer
Description: Parquet Data Viewer is an open-source tool for visually exploring and analyzing Parquet files. It allows you to view Parquet data structures, preview data values, run SQL queries, and generate statistics.
Type: software
Pricing: Open Source